Figure 3.

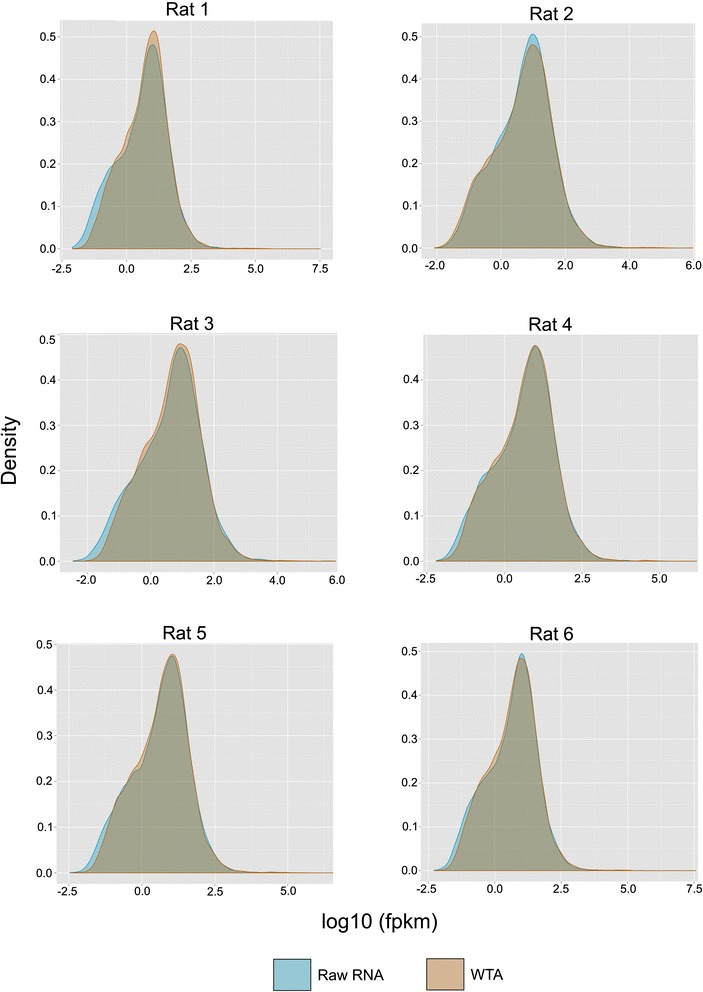
Distribution of gene expression levels across each sample/condition. Comparative distribution analysis of reads correlated to gene density in rat white adipose tissue.

Distribution of gene expression levels across each sample/condition. Comparative distribution analysis of reads correlated to gene density in rat white adipose tissue.