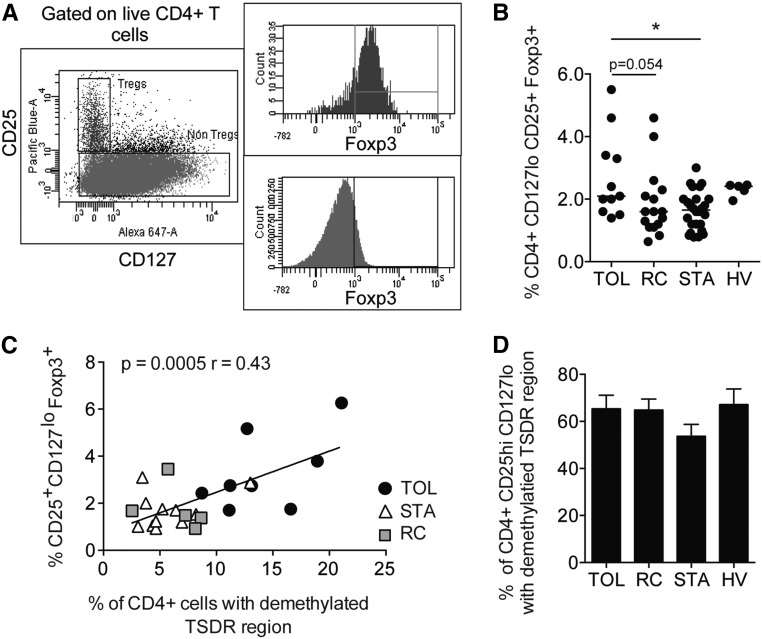
Figure 2.
Study of CD25hi CD127low Tregs. (A) Gating strategy for the identification of total Tregs. (B) Percentage of Tregs in the blood of individuals from the HV (n=5), TOL (n=10), STA (n=26), and RC (n=15) groups. (C) Correlation between the percentage of TSDR demethylation in CD4+ T cells and the percentage of total Tregs in the TOL (n=8), STA (n=11), and RC (n=5) groups. (D) Percentage of purified circulating CD25hi CD127low Tregs with TSDR demethylation, as measured using quantitative PCR in the TOL (n=8), STA (n=11), and RC (n=5) groups (D). *P<0.05.

