
Fig. 3.
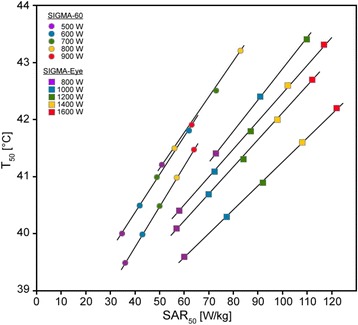
Simulated characteristic lines in a SAR/temperature diagram for both applicators and the available patient models by variation of total power until a threshold temperature is exceeded. Classification in easy (lines shifted to the left) - and difficult-to-heat (lines shifted to the right) patients. As the curves were very similar for patients treated in the Sigma-60 applicator we show only 3 curves for this applicator (the remaining curves would lie in the interspace between the depicted curves) to enhance the clarity of the figure