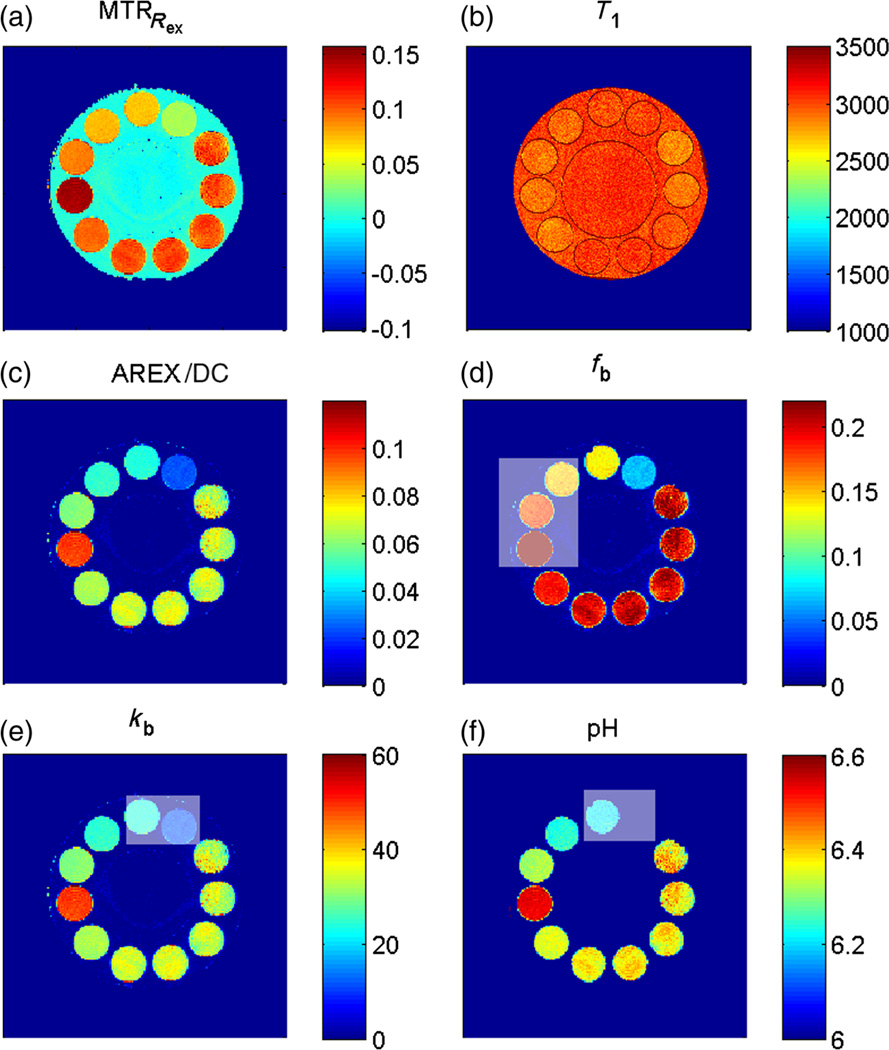
Figure 6.
Quantitative pulsed chemical exchange saturation transfer (CEST)-MRI. (a) MTRRex evaluated for B1 = 1 µT. Employing the T1 map (b), the spillover-corrected and T1–compensated apparent exchange-dependent relaxation (AREX) map can be calculated (c). Under the assumption of full saturation, AREX/DC yields a ka map. (d) fb map employing the exchange rate for creatine k(pH 6.38, T = 19 °C) = 35 s−1; it suggests that creatine has four exchanging protons. Using fb = 0.2%, a kb map (e) can be obtained from AREX, which correlates well with results from water exchange measurements. (f) Therefore, a pH(kb) map can be obtained using Equation [16]. Gray boxes indicate tubes in which either the concentration or pH was not constant.

