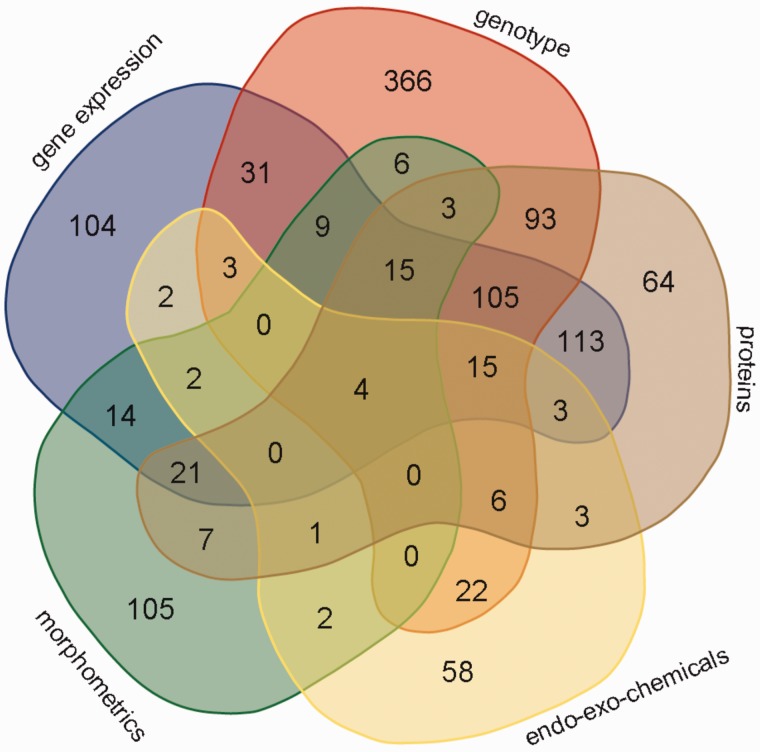
Figure 3.
Venn diagram showing the number of patients with data points from different combinations of experimental data categories. These categories include gene_expression, genotype, proteins, endo_eco_chemicals (drugs, endotoxins, glycosaminoglycans and steroids) and morphometrics. The data category other was excluded, because the Venn diagram can depict five categories at most; the category other had few data points. The Venn diagram tool is available at http://bioinformatics.psb.ugent.be/webtools/Venn/.

