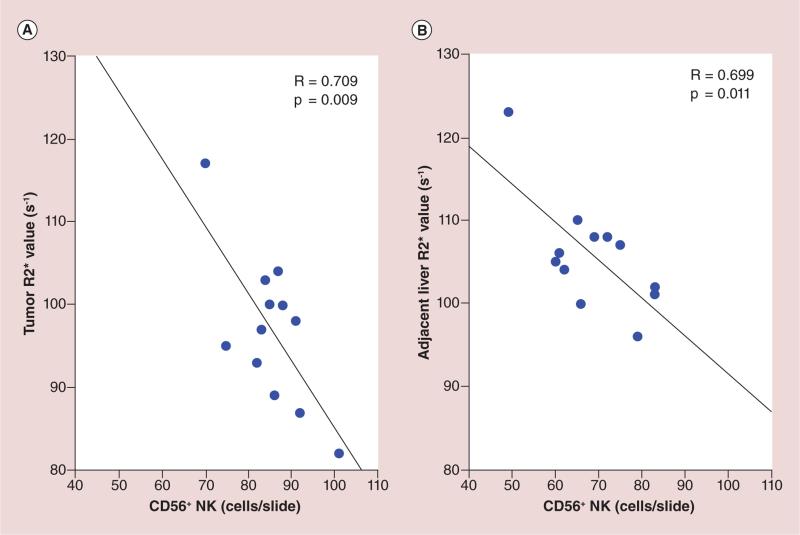
Figure 9. Comparison between MRI R2* measurements and histological natural killer (CD56) measurements within tumor and surrounding liver tissue at 12-h postinfusion interval.
R2* values measurements within tumor (A) and surrounding liver tissue (B) was well correlated with the histological NK measurements (R = 0.709, p < 0.05 for tumor; R = 0.699, p < 0.05 for surrounding liver tissue).
NK: Natural killer.

