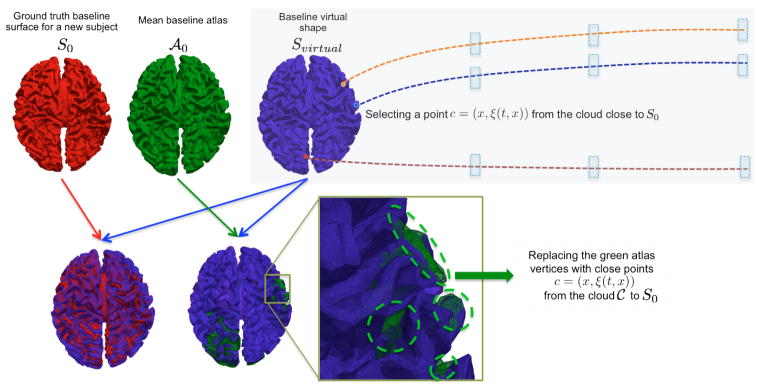
Fig. 3. Illustration of the concept of the cloud
 and the virtual shape Svirtual used in the prediction stage.

The green vertices visible in the overlap between the baseline atlas  and the virtual shape Svirtual were updated using better candidates from the cloud C. Notice that we have a good overlap between the baseline atlas shape and the baseline input shape S0. Orange, blue and red vertices belong to the cloud where their learnt trajectories can be easily retrieved to track forth their spatiotemporal deformation. The blue rectangles represent the later timepoints where the spatiotemporal atlas was estimated.
