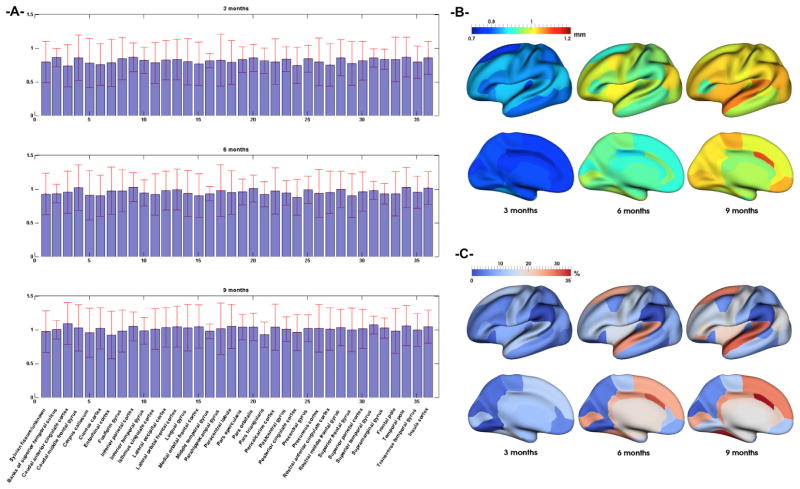
Fig. 5.
(A) Mean prediction error and its standard deviation (red bars) in mm across 9 testing infants in 36 cortical regions of interest (ROI). (B) Mean prediction error distance (in mm) of each ROI mapped onto inflated cortical surface. (C) Absolute surface area difference in each ROI (in %) between predicted and ground truth surfaces.

