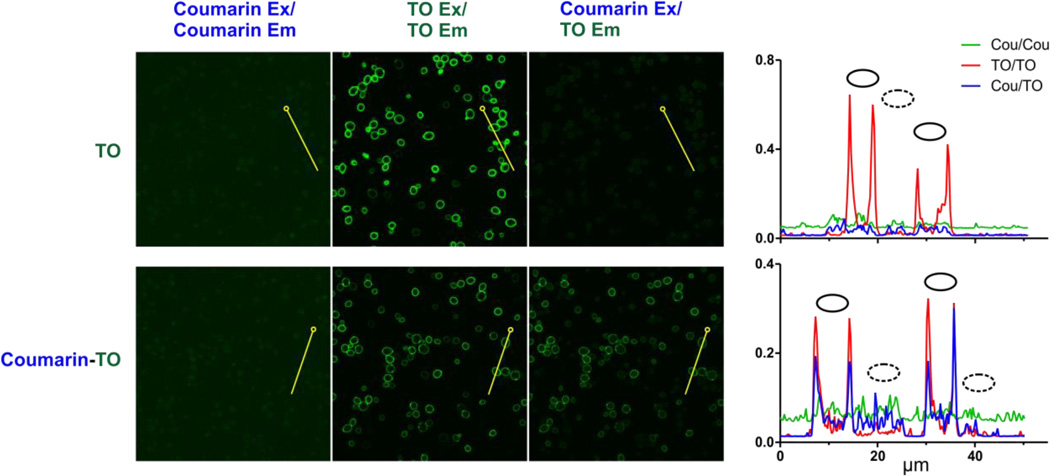
Figure 8.
Visualization of energy transfer using yeast surface surface-displayed R1 FAP. Confocal microscopy imaging was carried out in the presence of 10 nM TO control (top) or bichromophore Coumarin Coumarin-TO bottom). Samples were excited using either 405 nm (Coumarin Ex) or 488 nm (TO Ex) lasers. Three different channels were examined: donor channel (420–480 nm BP filter, left), acceptor channel (505–550 nm BP, middle) and FRET channel (505–550 nm BP, right).At the far right are shown scan profiles of these channels through cells along 50 µm transects (horizontal axis), traced in yellow with open circles marking transect origins. Vertical axes plot per pixel signal represented as proportion of 16 16-bit intensity scale. Solid ovals mark positions of fluorescent cells and dotted ovals mark positions of dark cells that do not express FAP due to absence of encoding plasmid. Control images that lo localize dark cells and other microscopy parameters are shown in Figure S26 and Table S2..

