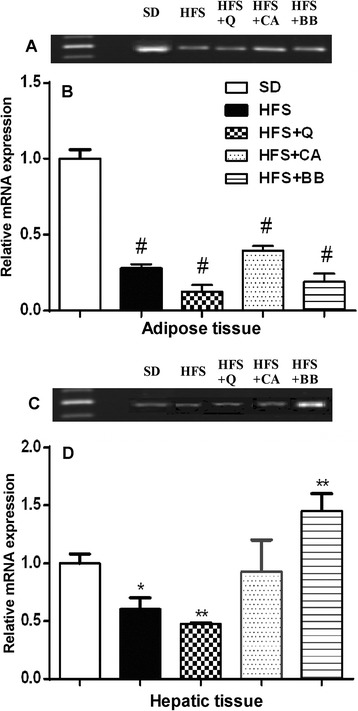
Fig. 5.

Effect of an HFS diet on the relative mRNA expression level of PPARγ in adipose and hepatic tissue, and the effect of the Q, CA and BB treatments on the modulation of these changes. The data are presented as one representative experiment (a and c) and accumulated data from three independent experiments are expressed as the mean ± SE (b and d). * p < 0.05, ** p < 0.01, *** p < 0.001, # p < 0.0001. (ANOVA with Newman-Keuls multiple comparisons test)
