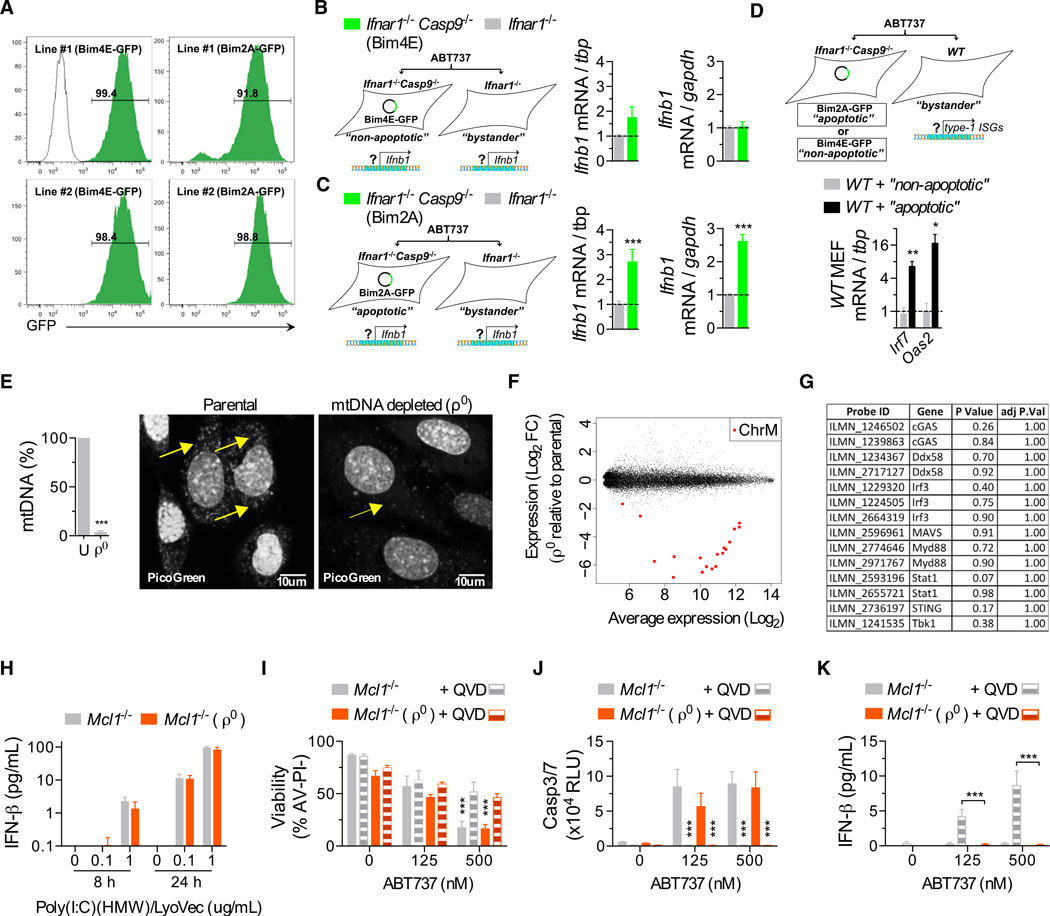
Figure 6. mtDNA Triggers Type IIFN Production during Caspase-Inhibited Apoptosis.
(A) Representative plots of infection efficiency of the MEFs used in (B–D).
(B and C) Real-time qPCR analysis of nonapoptotic (expressing Bims4E, B) and apoptotic (expressing Bims2A, C) MEFs and their respective Ifnar1−/− bystander from cocultures after treatment with ABT-737 (500 nM) for 18–20 hr (data combined from three experiments, with two independent MEF lines per genotype). mRNA expression is shown relative to two independent housekeeping genes, tbp and gapdh.
(D) Real-time qPCR analysis of WT bystanders from cocultures after treatment with ABT-737 for 18–20 hr (data combined from two experiments, with two independent MEF lines/genotype).
(E) Real-time qPCR analysis of mtDNA content from Mcl1−/− MEFs cultured in ethidium bromide to generate mtDNA-depleted (ρ0) MEFs (used in F-J). Representative image of MEFs stained with PicoGreen nucleic acid stain. Arrows indicate mtDNA. Scale bars, 10 um. See also Figure S4.
(F) Scatterplot of differentially expressed probes from microarray analysis of Mcl1−/−ρ0 MEFs compared to their respective parental Mcl1−/− MEF. (n = 3 independent MEF lines). Chromosome M, ChrM. See also Table S2.
(G) Table of a selected set of type I IFN response genes from analysis in (F).
(H) Bar graph of IFN-β in the supernatant of ρ0 and parental MEFs transfected with Poly(I:C)(HMW) (n = 3 independent MEF lines).
(I–K) (I) Bar graphs of the viability of ρ0 and parental MEFs treated with ABT-737 ± 20–30 µM of Q-VD-Oph (QVD) for 24 hr, (J) caspase activity after 6 hr, and (K) IFN-β in supernatant after 24 hr (n = 4 independent MEF lines).
Means were compared using a two-tailed t test. Data represent the mean ± SEM. *p ≤ 0.05, **p ≤ 0.01, and ***p ≤ 0.005.

