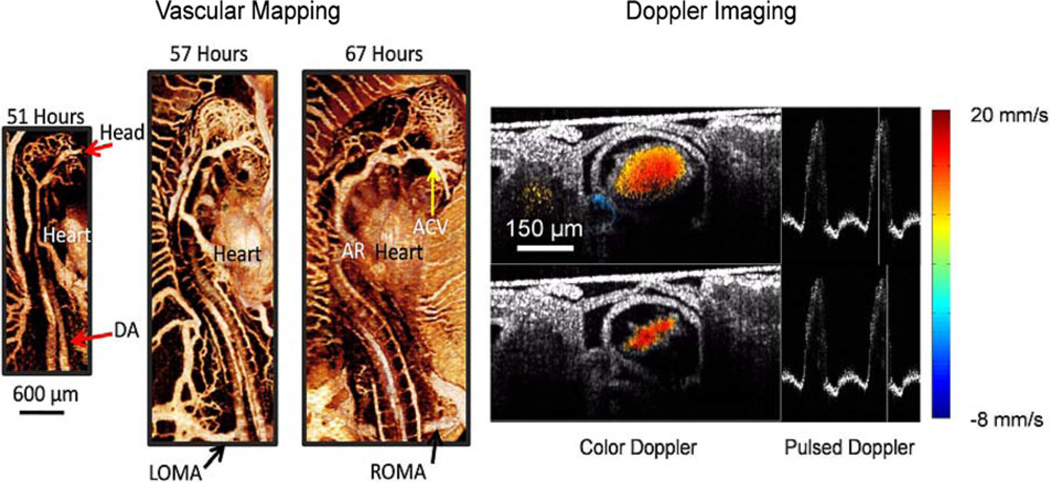
Fig. 5.
Vascular maps and Doppler imaging. (Left) Vascular imaging is combined with longitudinal imaging. Vascular maps are shown of a quail embryo at 51, 57, and 67 h. Vascular maps allow investigations into the entire cardiovascular system. (Right) Gated Doppler imaging through the middle (transverse) of a stage 14 embryonic quail heart. Two time points in the cardiac cycle are shown. Gated imaging allows us to capture 60 frames/heartbeat. Pulsed Doppler profiles adjacent to the color Doppler images show the shape of the heartbeat and the position of the frame in the cardiac cycle. The color Doppler images display the relative blood velocity as shown in the color bar (blue—toward the OCT beam; red—away from the OCT beam). Here, we set velocities resulting from forward flow to be positive. DA—dorsal aorta; AR—aortic root; LOMA—left omphalomesenteric artery; ROMA—right omphalomesenteric artery; and ACV—anterior cardinal vein.

