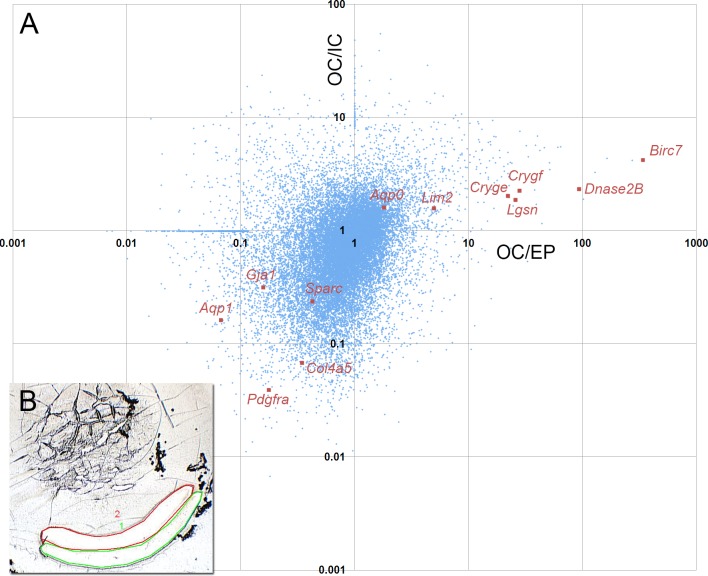
Figure 1.
Microarray analysis of depth-dependent gene expression in 1-month-old mouse lenses. (A) Scatterplot of microarray data showing relative levels of gene expression in EP cells, OC and IC fiber cells. The quadrants define four distinct patterns of lens gene expression. The lower left quadrant, for example, contains transcripts that are highly expressed in the epithelium (with respect to either of the fiber samples). Epithelial specific transcripts, Aqp1, Pdgfra, Gja1, Sparc, and Col4a5 are located in this quadrant. Transcripts that show upregulated expression in both the early and late stages of fiber differentiation are shown in the upper right quadrant. Members of this group include genes known to be expressed predominantly in fiber cells, such as Aqp0, Lim2, and the gamma crystallins Cryge and Crygf. Among strongly upregulated genes in this quadrant are the late fiber genes Dnase2B and Lgsn. The most upregulated transcript, with expression levels several hundred–fold higher in the inner cortical fibers than in the epithelium, is Livin. The other two quadrants contain transcripts that are transiently upregulated (lower right quadrant) or downregulated (upper left quadrant) during early fiber cell differentiation. (B) The inset shows an example of a frozen lens section from which the OC (green) and IC (red) samples were collected by laser microdissection.

