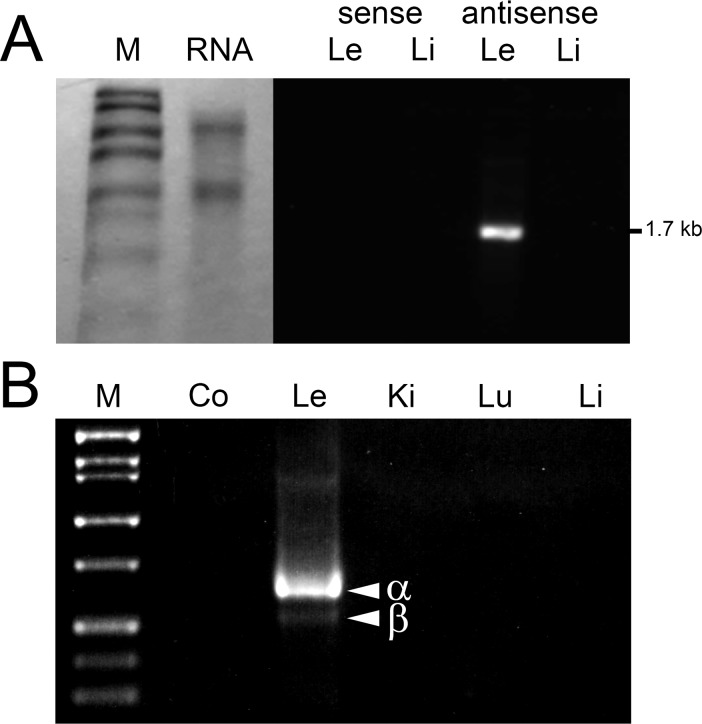
Figure 2.
Expression of Livin mRNA in mouse tissues. (A) Northern blot analysis identifies a 1.7-kb transcript in total RNA extracted from lens (Le) but not liver (Li). Sense control probe does not hybridize to RNA from either tissue. (B) Two amplicons (α and β) are detected following endpoint PCR amplification of lens cDNA with Livin-specific primers. The larger and more abundant amplicon corresponds to Livin α and the smaller amplicon to Livin β. The identity of the amplicons was confirmed by sequencing. Co, negative control (lacking template DNA); Ki, kidney; Lu, lung; M, marker.

