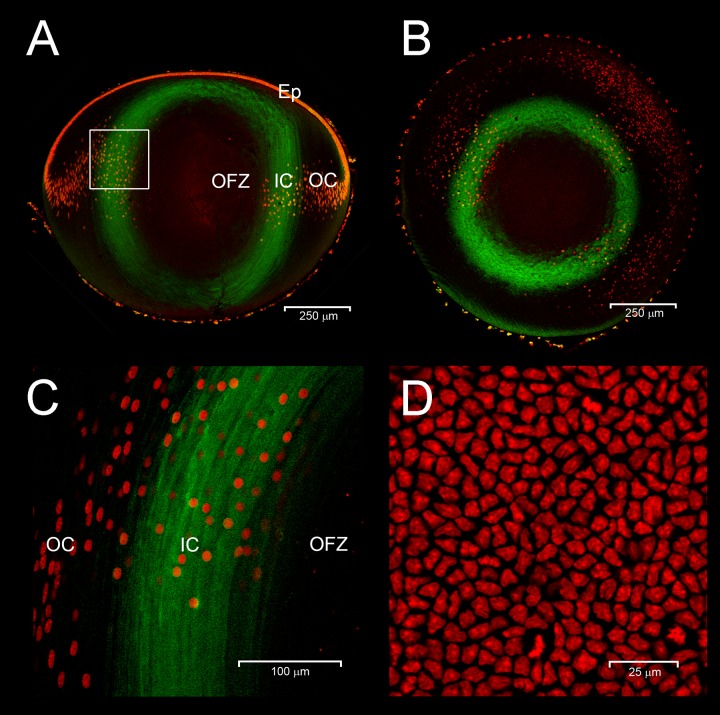
Figure 7.
Livin expression in P1 mouse lens. Sagittal (A) and equatorial sections (B) show Livin expression (green) in fiber cells in the IC region. The boxed region in (A) is shown at higher magnification in (C). The disappearance of fiber cell nuclei (red) marks the border of the OFZ. Note that Livin is expressed by fiber cells immediately prior to denucleation. In expressing fiber cells, Livin immunofluorescence is distributed throughout the cytoplasm. En face views of the lens epithelium (D) demonstrate the absence of Livin expression in this cell population. Scale bars: (A) 250 μm, (B) 250 μm, (C) 100 μm, (D) 25 μm.

