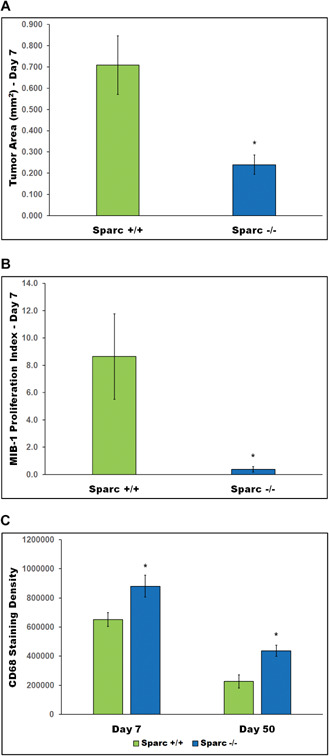
Figure 5.

Intracranial xenografts were quantitated and analyzed statistically for tumor area (A) MIB‐1 proliferation index, (B) and CD68 staining density (C). Asterisks denote significantly different from Sparc‐wt where * represents P = 0.0091 for tumor area, P = 0.0345 for proliferation index and P < 0.0001 for CD68 staining density.
