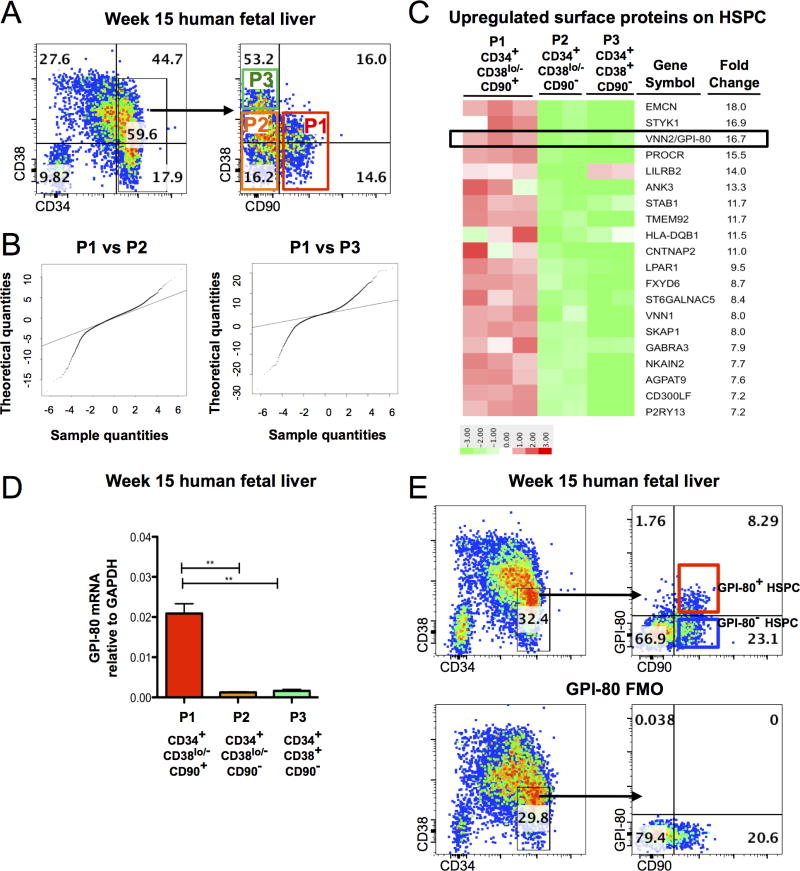
Figure 1. A subpopulation of human fetal liver HSPC express GPI-80/VNN2.
A. Flow cytometry plot of hematopoietic populations from Ficoll-purified week 15 human FL with CD34, CD38 and CD90 documenting subfractionation of CD34+ cells to P1 (CD34+CD38lo/−CD90+), P2 (CD34+CD38lo/−CD90−) and P3 (CD34+CD38+CD90−). Quadrants were drawn according to FMO (fluorescence minus one) control. B. Quantification of engrafted cells in murine bone marrow at 16 weeks post-transplantation with representative flow cytometry plots (n=3 mice/group). C. Quantile-Quantile plots comparing differentially expressed genes between P1 (CD34+CD38lo/−CD90+) vs. P2 (CD34+CD38lo/−CD90−) or P3 (CD34+CD38+CD90−). D. 20 cell surface proteins upregulated in CD34+CD38lo/−CD90+ HSPC vs. CD34+CD38lo/−CD90− HPC. E. qRT-PCR of GPI-80 mRNA in CD34+CD38lo/−CD90+ population as compared to CD34+CD38lo/− CD90− and CD34+CD38+CD90− cells (p≤0.01) (n=3 different donor tissues). Error bars represent mean ± SEM. F. Representative flow cytometry plot of Ficoll-purified, CD34+ enriched cells from 15 week developmental age FL stained for CD34, CD38, CD90 and GPI-80. FMO control for GPI-80 is shown. See also Figure S1 and Table S1.

