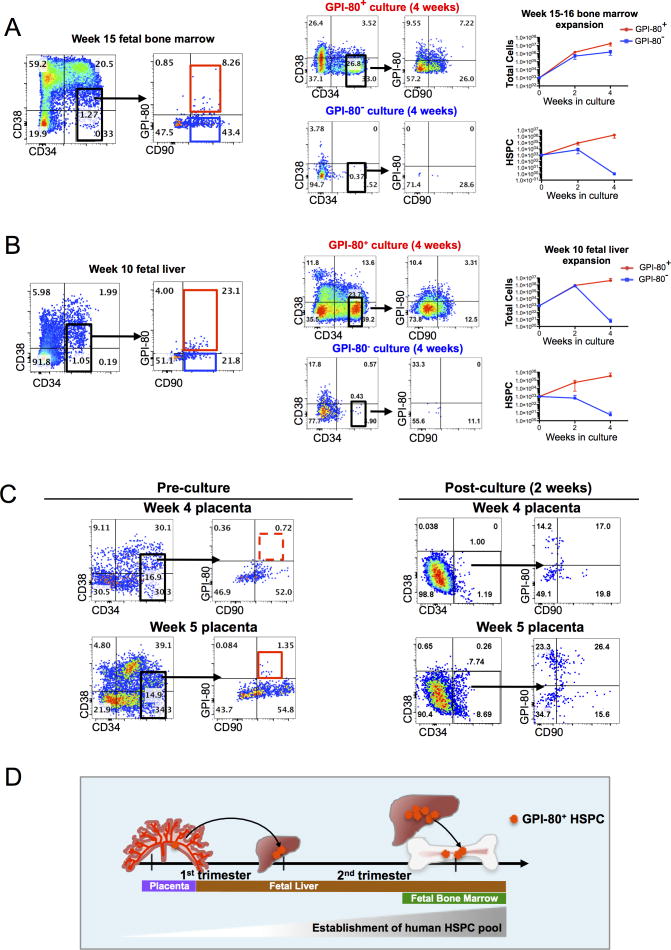
Figure 3. GPI-80 tracks self-renewing HSPC during human development.
A. Flow cytometry plot of 15 week fetal BM with CD34, CD38, CD90 and GPI-80 is shown. Representative FACS plots and growth curves of cultured GPI-80+ and GPI-80− HSPC from fetal BM are shown (n=3 independent experiments with different donor tissues). Error bars represent mean ± SD. B. Representative flow cytometry plots of 10 week human FL with CD34, CD38, CD90 and GPI-80 is shown. Representative FACS plots and growth curves of cultured GPI-80+ and GPI-80− HSPC from 10 week FL are shown (n=3 independent experiments with different donor tissues). Error bars represent mean ± SD. C. Representative flow cytometry plots of 4 and 5 week placenta stained with CD34, CD38, CD90 and GPI-80 are shown. Representative flow cytometry plots of CD34+ placental cells after 2 week in culture on OP9M2 are shown. D. Model of timeline of migration of GPI-80+ HSPC in first and second trimester human hematopoietic tissues. See also Figure S3.

