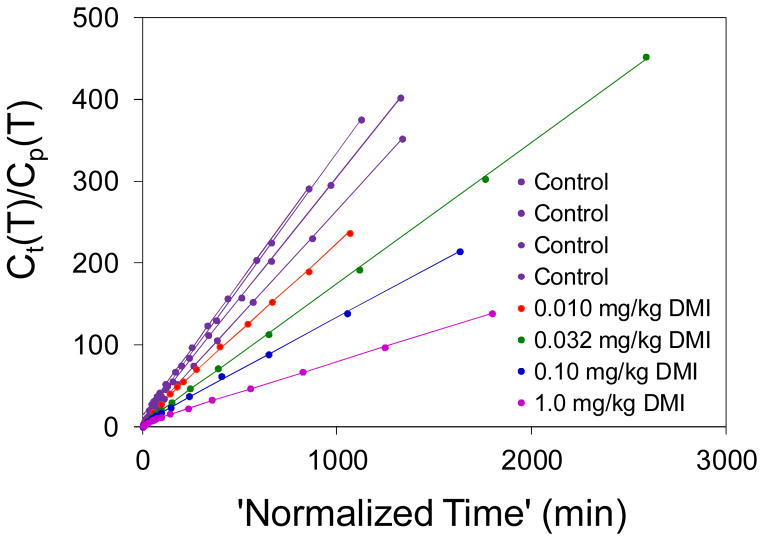
Figure 8.
Patlak graphical analysis of the myocardial kinetics of [18F]1 kinetics in rhesus macaque monkeys under control conditions (n = 4) and following DMI block of cardiac NET at four different DMI dose levels. Patlak plots were highly linear in all cases (r2 > 0.99) and the Patlak slopes declined in a dose-dependent manner with increasing DMI doses.

