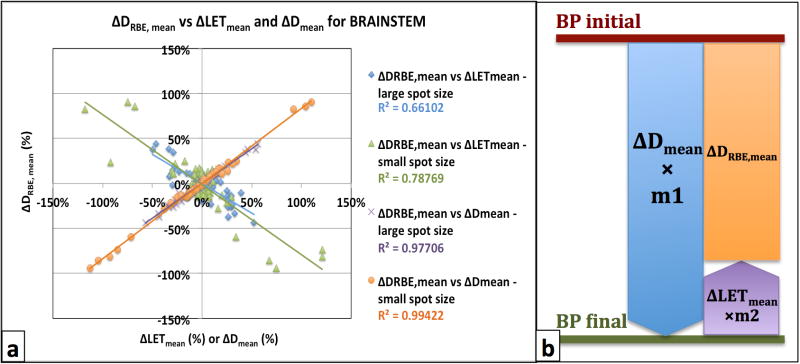
Figure 4.

(a) Plot showing how differences in mean RBE-weighted doses (ΔDRBE, mean) correlate with differences in mean LET (ΔLETmean) and mean Dose (ΔDmean) values for both beam spot sizes (large: 12mm on average, small: 3mm on average). The R2 values on the legend represent the coefficient of determination for each set of data. (b) Schematic diagram of equation 3 accounting for the inverse correlation between ΔDmean and ΔLETmean.
