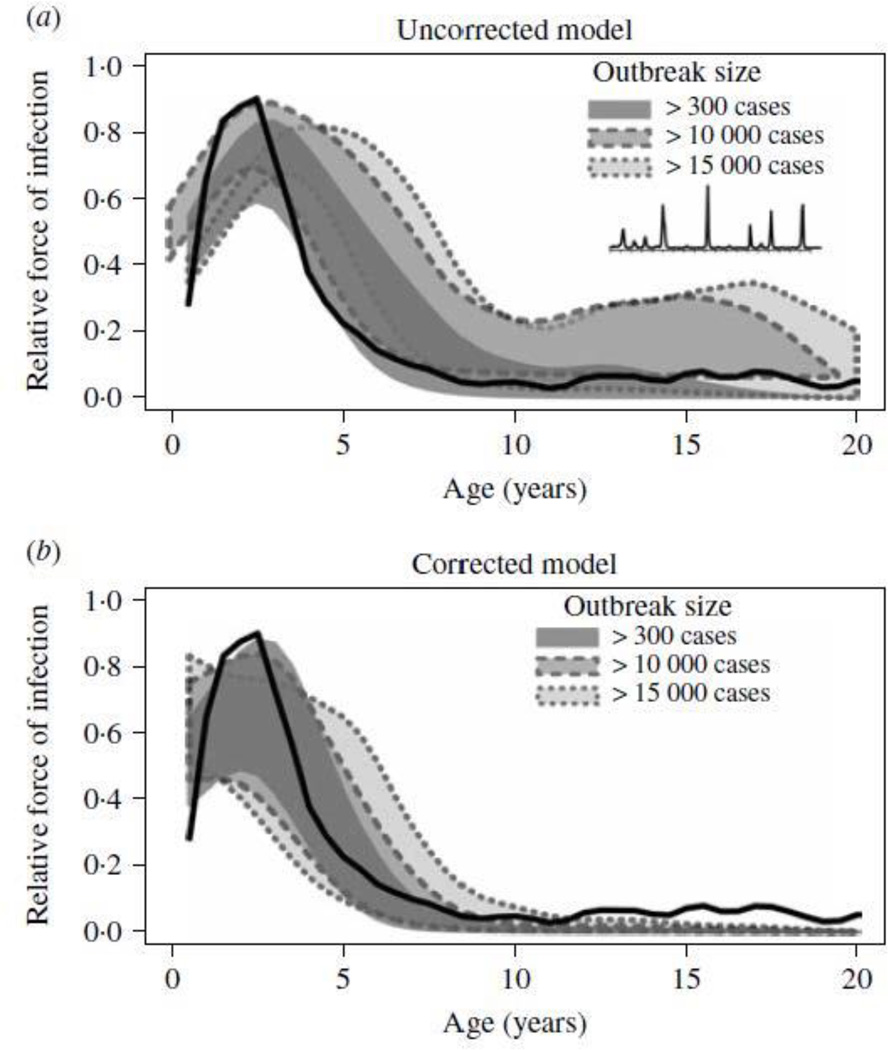
Fig. 2.
Distribution of estimates of relative age-specific force of infection (FOI) for simulated episodic time-series. For each simulation, the FOI is scaled to have a maximum at 1 for presentation. Shaded regions give the central 50% of estimates for outbreaks of size >300 (solid lines, n = 416 epidemics), >10 000 (dashed lines, n − 99), and >15 000 (dotted lines, n = 37). The solid line indicates true relative age-specific FOI for the simulation. (a) Estimates assuming constant incidence history, (b) estimates corrected using the epidemic history.

