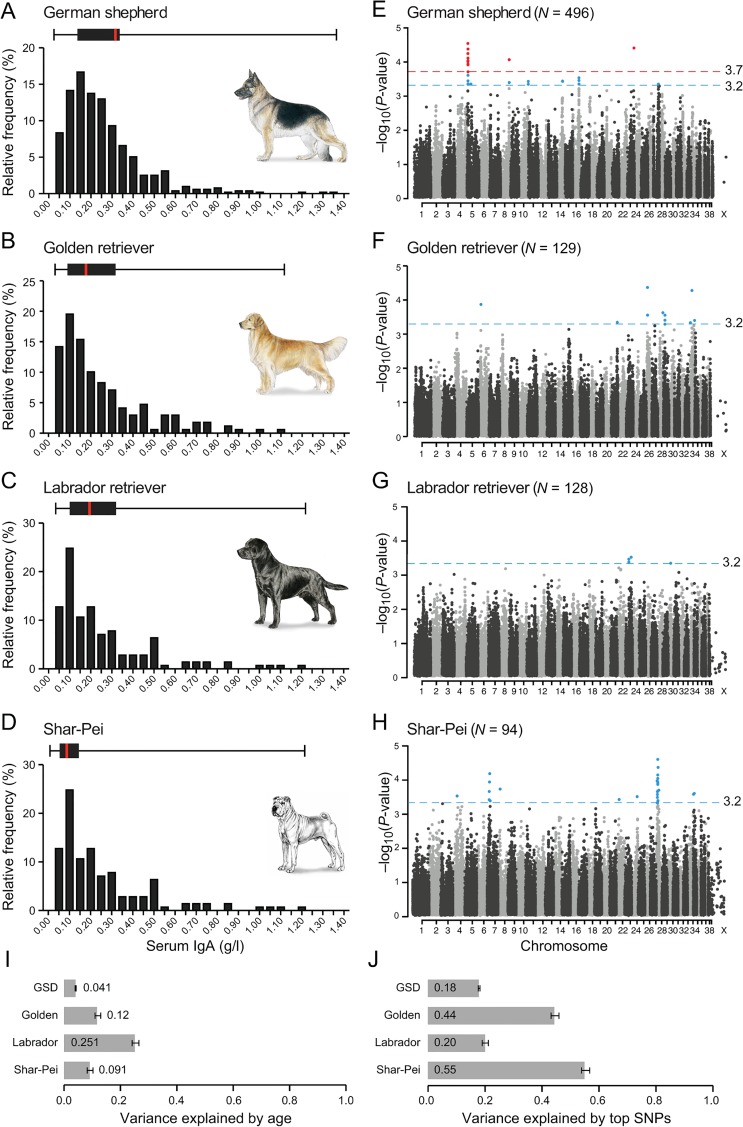
Fig 1. A combined GWAS in four breeds identifies 35 loci associated with IgA levels.
(A-D) The distribution of IgA levels (0–1.40 g/l) clearly varied between the four breeds, here presented as relative frequency (%) and as box plots with the black box marking percentile 25 to 75 and red bar the median. The combined GWAS analyses from four runs (IgA levels divided into 2, 3, 4 and 5 groups) are presented in panel E-H, with the nominal significance defined at-log10p of 3.2 (grey line). In GSD (E), one region (14 SNPs) on CFA5 and single SNPs on CFA8 and CFA23 showed genome wide significance (red line at-log10p of 3.7) based on 1,000 permutations in five groups. In total, 35 suggestively associated loci (8 in GSD, 8 in GR, 3 in LR and 16 in SP) were defined based on LD of r2 >0.8 within 0.5 Mb of the top SNP. The fraction of phenotypic variance explained by (I) phenotypic variance explained by age was the lowest in GSD (4%) and remarkably high in LR (25%) and (J) the top SNP in each of the suggestively associated loci varied from 18% in GSD to 55% in SP.

