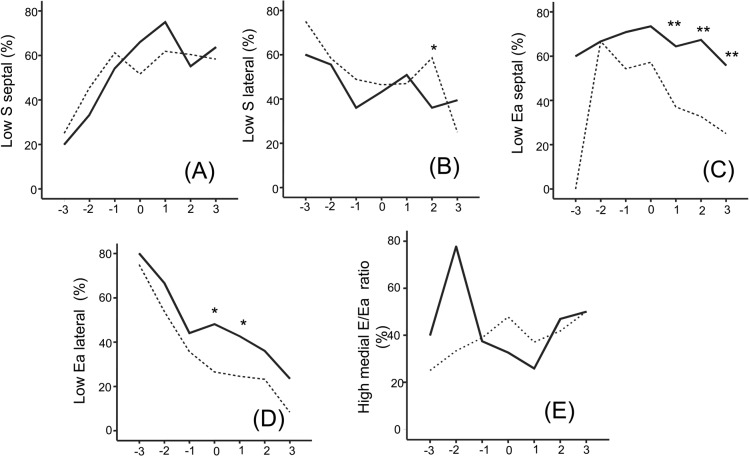
Fig 4. Frequencies of abnormal TDI during the course of the illness.
Percentages of DF (dotted lines) and DHF cases (solid lines) with low septal and lateral S wave (A, B) and septal and lateral Ea wave (C, D) and high E/Ea ratios (E) determined based on published age-specific normal values (21). * different from DF (P < .05).

