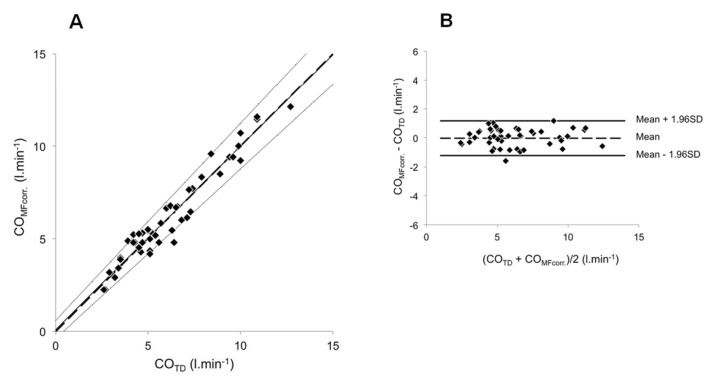
Fig 4. Relationship between COMFcorr. and COTD.
COMFcorr. determined in 26 patients (48 values). (A) For each subject, COMFcorr. values were plotted against the corresponding COTD values. The broken line corresponds to the line of equality, solid line is the mean regression lines and dotted lines delimit the confidence interval of the regression lines. (B) Difference between COMFcorr. and COTD values plotted against their mean. Broken line represents the mean (-0.03 L·min-1) and the solid lines the 95% limits of agreement (-1.23 L·min-1 to +1.17 L·min-1).

