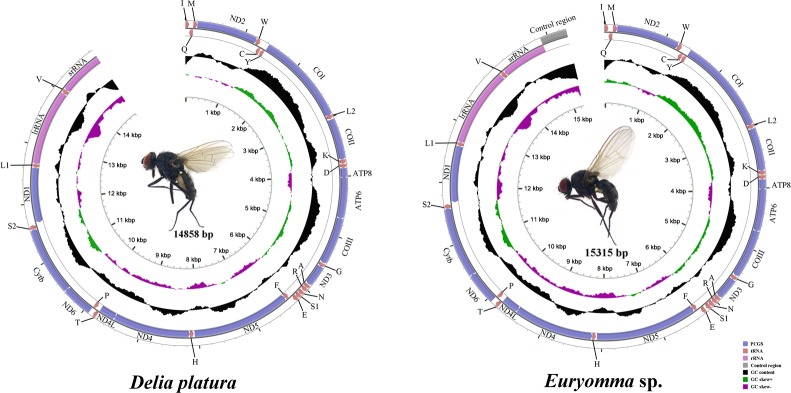
Fig 1. Mitochondrial maps of two muscoid flies.

Circular maps were drawn with GCView [53] with the unsequenced portion of each genome indicated. Gene arrangement is shown on the outermost circle with arrows indicating the orientation of gene transcription. tRNAs are are labelled according to the IUPACIUB single-letter amino acid codes (L1: CUN; L2: UUR; S1: AGN; S2: UCN). GC content was plotted (in black) using a sliding window, as the deviation from the average GC content of the entire sequence. GC-skew was plotted (positive skew in green, negative skew in purple) as the deviation from the average GC-skew of the entire sequence. The innermost cycle indicates size.
