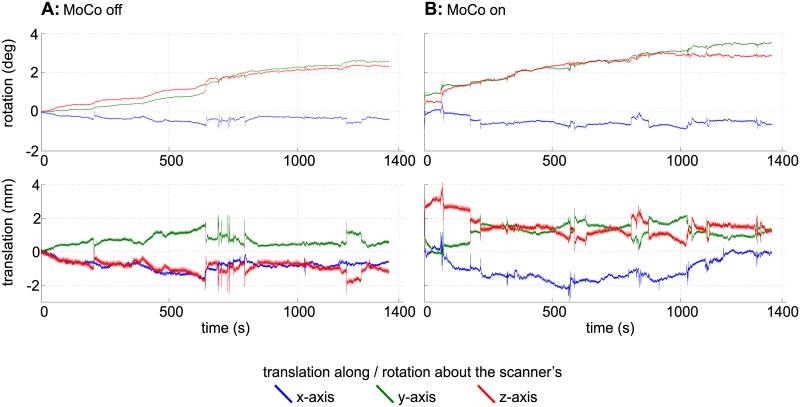
Fig 5. Motion plots for the GRE comparison scans.
The plots show the translations and rotations recorded during the GRE scans (Fig 4) without (A) and with (B) motion correction. For this plot, the data delivered by the MPT tracking system were converted to scanner coordinates.

