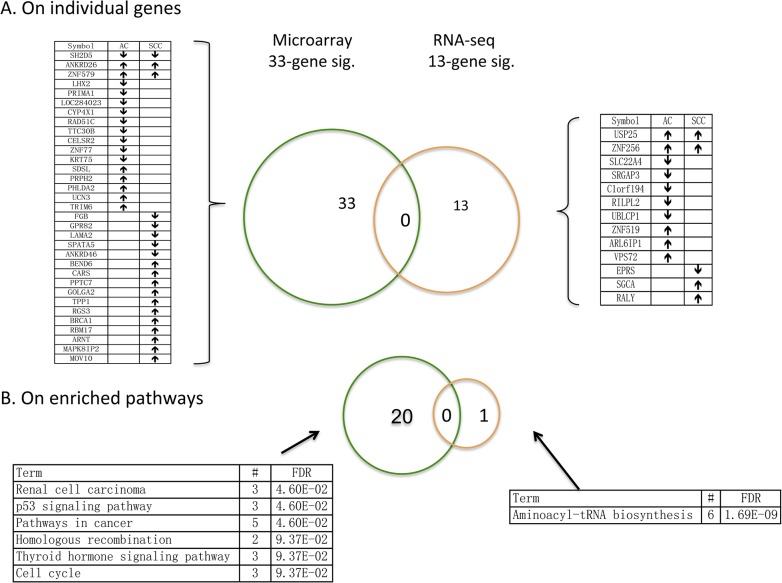
Fig 2. Venn diagrams of 33- and 13-gene signatures.
A) On the individual gene level. B) On the enriched pathway level. 33-gene and 13-gene signatures were obtained using Cox-TGDR-specific algorithm with one being trained on the microarray data and the other on the RNA-seq data. Here,↓ and ↑ indicate a negative and positive association with hazard of death, respectively.

