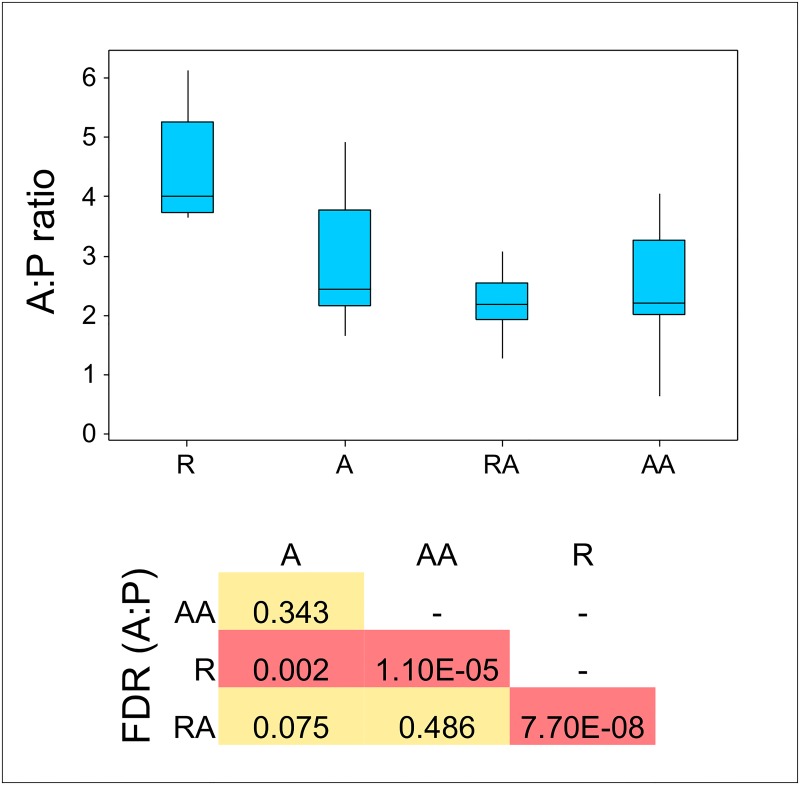
Fig 7. Acetate:Propionate (A:P) ratios in rumen samples from all groups.
Group R (n = 14), A (n = 13), RA (n = 15) and AA (n = 13). Box and whisker plot showing median, quartiles, maximum and minimum values. FDR = BH-corrected P values derived from Wilcoxon pairwise comparisons of A:P ratios between different treatment groups.

