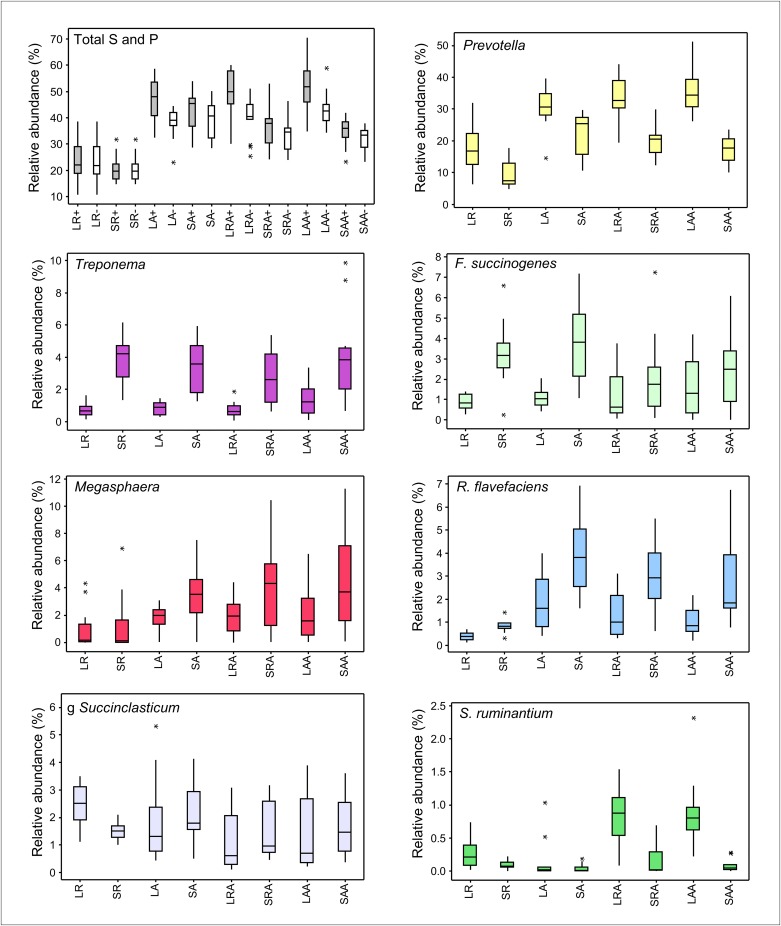
Fig 8. Differences in relative abundance of succinate and propionate producers between treatment groups.
Box and whisker plots showing median, quartiles, maximum and minimum values, and outliers (asterisks) for the sum of relative abundances within each rumen sample of OTUs assigned to taxonomic groups (apart from Succinivibrionaceae) which are, or have members which are, succinate and propionate (S and P) producers. ‘Total S and P’ box and whisker plot shows sum of relative abundances of all OTUs assigned to S and P taxonomic groups excluding OTU-S3004 (white boxes-) and including OTU-S3004 (grey boxes +). LR = Liquid Restricted (n = 14), SR = Solid Restricted (n = 14), LA = Liquid Ad lib (n = 13), SA = Solid Ad lib (n = 13), LRA = Liquid Restricted/Ad lib (n = 15), SRA = Solid Restricted/Ad lib (n = 15), LAA = Liquid Ad lib/Ad lib (n = 13), SAA = Solid Ad lib/Ad lib (n = 13).

