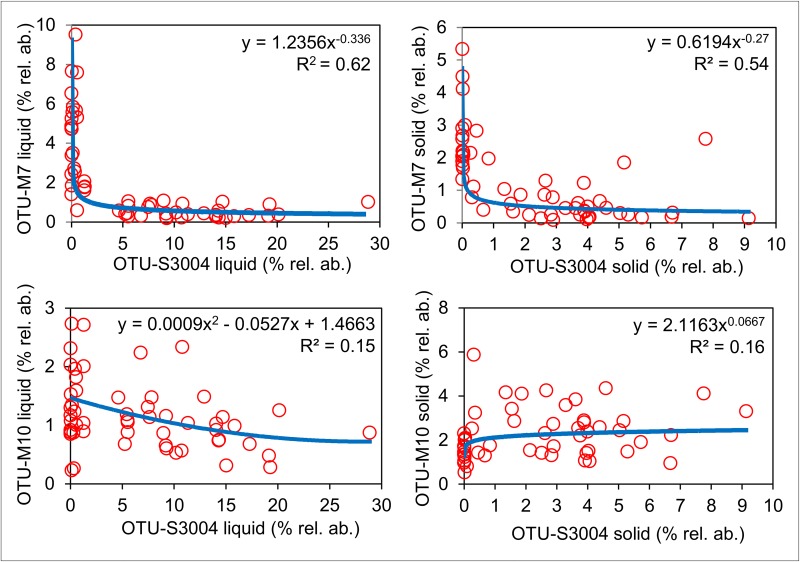
Fig 9. Correlation analysis of OTU-M7 and OTU-M10 with OTU-S3004.
Scatter plot analysis of percentage relative abundances (% rel. ab.), in all liquid and solid fraction samples, of OTU-M7 (Methanobrevibacter gottschalkii clade) and OTU-M10 (Methanobrevibacter ruminantium clade) plotted against OTU-S3004. Power regression (blue dashed line) showed the highest R2 values (shown on each scatter plot) in all comparisons apart from OTU-M10 (liquid) vs. OTU-S3004 (liquid) for which a polynomial regression showed the highest R2 value.

