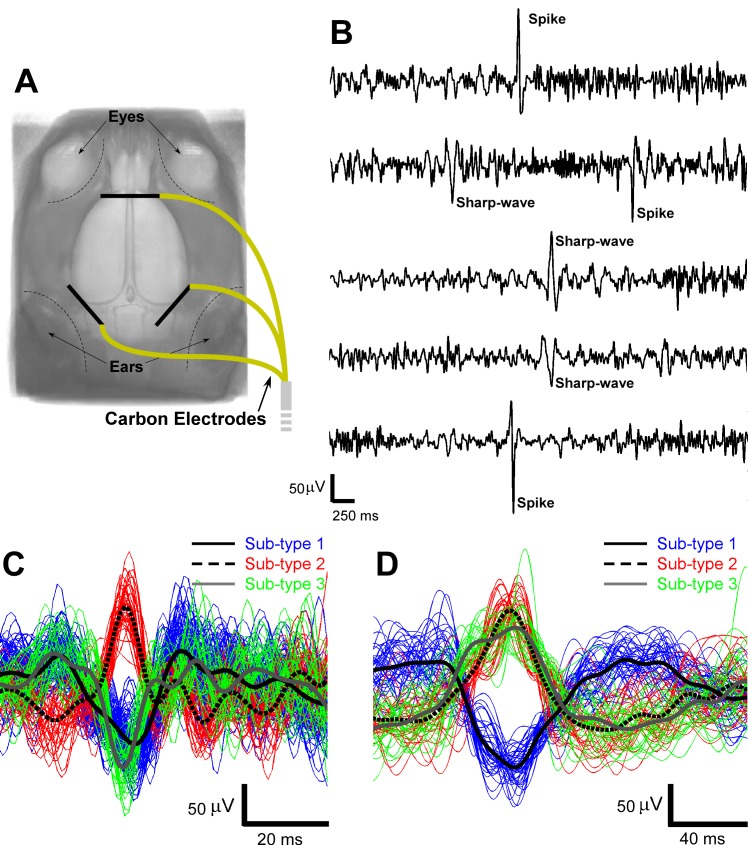
Fig 1. EEG acquisition and classification.
(A) The locations of the three carbon electrodes implanted subcutaneously on top of the skull for EEG acquisition. (B) Representative EEG signals with artifacts removed and spike and sharp-wave marked. Color-coded sub-types of spikes (C) and sharp-waves (D). In both subplots, the black lines in different styles represent the averaged temporal profiles for each sub-type. EEG = electroencephalography.

