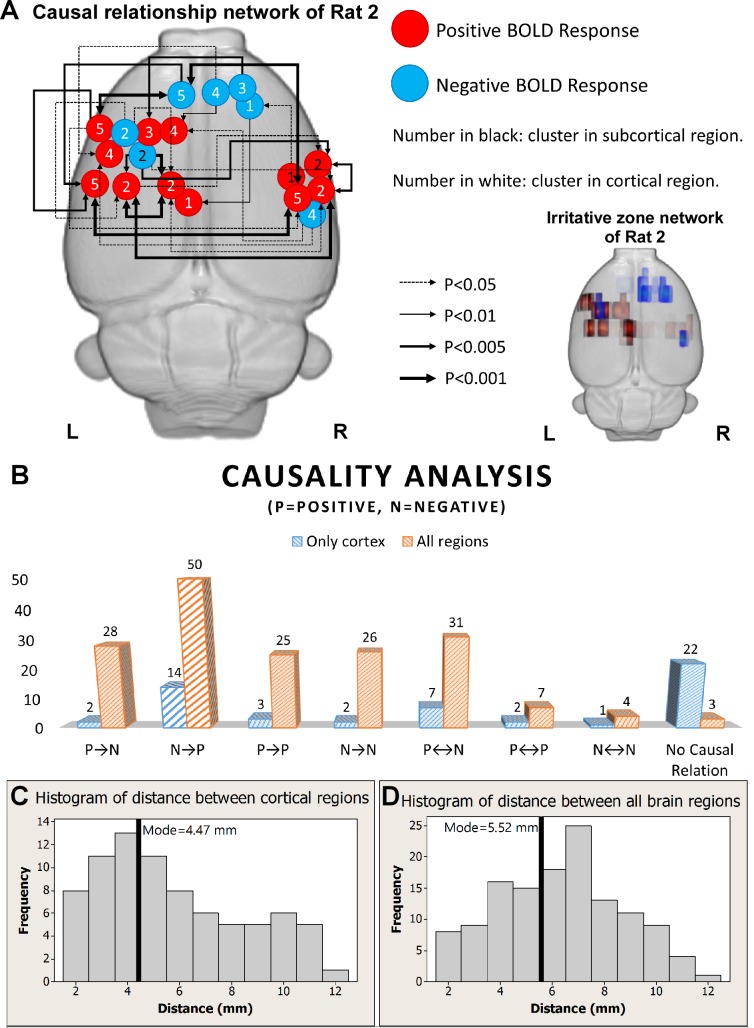
Fig 4. Granger causality analysis.
(A) Illustration of the causal relationship among BOLD response clusters evoked by all identified sub-types of genuine IEDs (n = 5) for Rat 2 (left). The actual locations and extensions for all BOLD response clusters are shown on the right (activations—red and deactivations—blue). The predominant relationship shown here was that BOLD deactivations have a directed influence on activations. (B) Summary of the Granger causality analysis for all six rats. The blue bars were from the results of the analysis including only clusters in the cortex. Most of these clusters showed no causal relationships (n = 22). The orange bars were from the analysis performed including clusters from both the cortical and subcortical regions. Both analyses depicted that predominantly areas with BOLD deactivations have directed influences on areas with activations. (C) Histogram of the distance between cortical areas with activation and deactivation. The mode of the distribution is 4.47 mm, marked by black solid line. (D) Histogram of the distance between activation and deactivation but, in this case, including areas from the entire brain, i.e. cortical and sub-cortical regions. The mode of the distribution is 5.52 mm, marked by the black solid line. R = right; L = left; BOLD = blood-oxygen-level dependent; IED = interictal epileptiform discharge.

