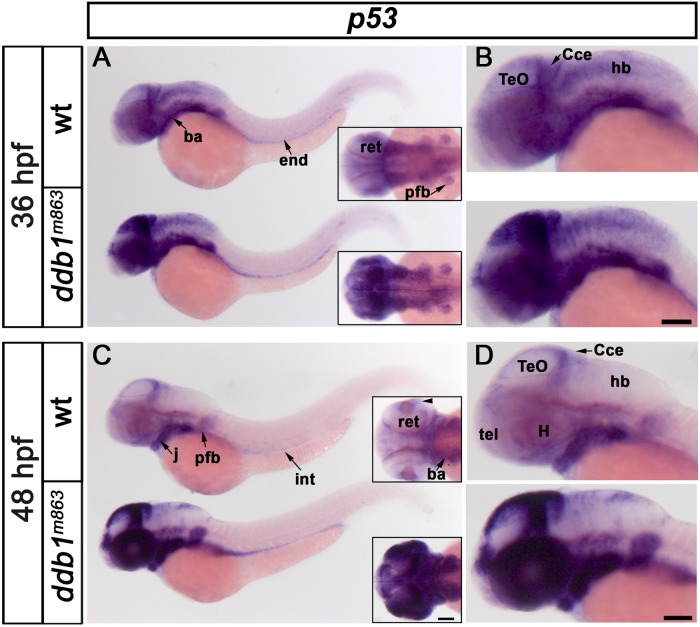
Fig 5. Increase of p53 transcript levels in ddb1 m863 mutants.
(A-D) Lateral (A-D) and dorsal views (inserts in A, C) of p53 expression pattern in embryos at 36 hpf (wt, n = 30; mut, n = 8) and 48 hpf (wt, n = 25; mut, n = 11). The transcription of p53 was prominently enhanced in ddb1 m863 mutant embryos. Anterior towards the left. Abbreviations used: ba, branchial arches; Cce, cerebellum; end, endoderm, H, hypothalamus, hb, hindbrain; j, jaw; pfb, pectoral fin bud; tel, telencephalon; TeO, tectum opticum. Scale bar: 100 μm

