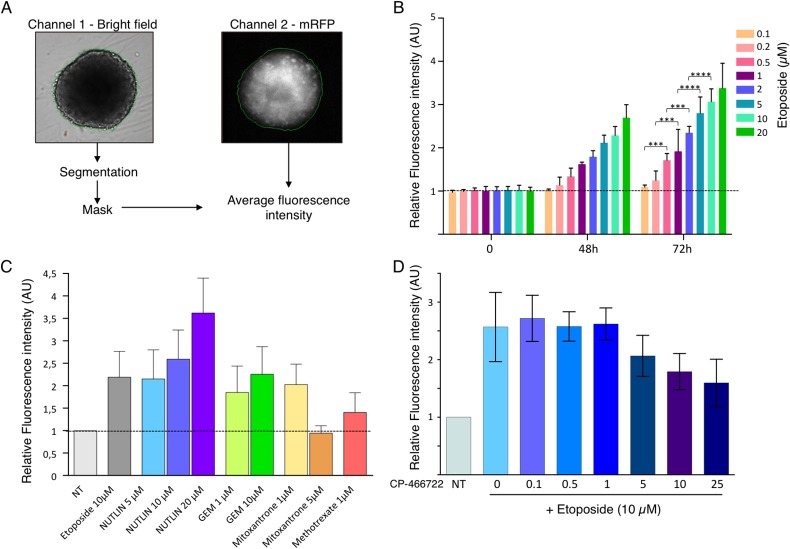
Fig 4. Use of DDR-Act-FP for the dynamic monitoring of DDR activation in live 3D spheroids.
Spheroids were prepared with HCT116 cells expressing the DDR-Act reporter in 96 well plates. Relative fluorescence intensity to the untreated control was monitored on live spheroids at the indicated time and in the presence of the indicated compounds. The results are the average of determination on 6 spheroids for each experimental condition. (A) Image acquisition were automatically performed on an ArrayScan (Cellomics) using the Thermo Cellomics Compartimental Analysis V4 software. The bright field channel was used to perform segmentation and to create a mask used to extract the mRFP average fluorescence intensity from the second channel. A spheroid treated for 24 hours with 5μM etoposide was used in this illustration. (B) Bar graph shows the mean relative fluorescence intensity+SD after 48h and 72h of growth in the presence of the indicated concentrations of Etoposide (3 to 5 independent experiments, with 6 samples per condition). ***: P<0.005, ****: P<0.001. (C) Mean relative fluorescence intensity+SD after 24h in the presence of the indicated compounds. (D) Mean relative fluorescence intensity+SD after treatment for 24 hours with increasing concentration of the ATM inhibitor CP-466722 prior to incubation in the presence of 10μM Etoposide for 48 hours (3 independent experiments with 6 samples per condition for each).

