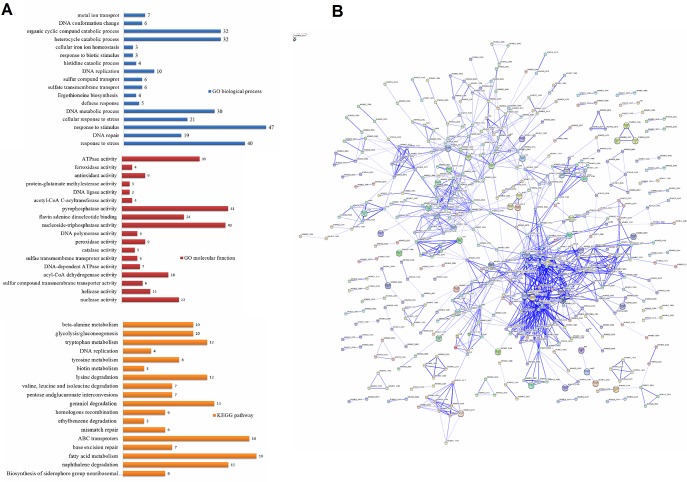
Fig 3. Overview of the differential expression profiles in response to 0.2 mM H2O2 in M. smegmatis.
(A) Enrichment analysis. The differently colored bars indicate the gene number for the enrichment of the annotations. (B) Interaction network of the differentially expressed genes of M. smegmatis induced by 0.2 mM H2O2 using STRING (9.1) at confidence scores ≥ 0.4. The network is enriched among the 634 differentially expressed genes and 111 interactions were observed (p value = 0).

