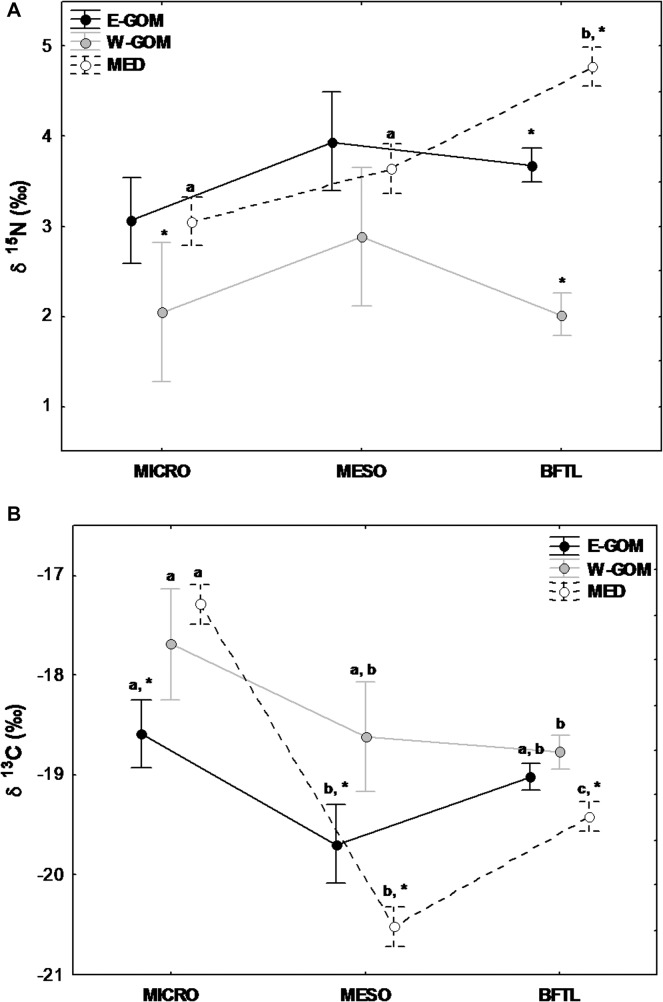
Fig 4. Mean nitrogen and carbon isotopic signature in MICRO, MESO and BFTL.
δ15N (A) and δ13C (B) isotopic signature (Mean±SE) for different planktonic compartments analyzed (microzooplankton [MICRO,55−200 μm], mesozooplankton [MESO, >200 μm] and bluefin tuna larvae [BFTL]) in Eastern Gulf of Mexico (E-GOM) (●), Western Gulf of Mexico (W-GOM) (●) and Balearic Sea (MED) (○) regions. Regions (E-GOM, W-GOM and MED) and plankton size fraction (MICRO, MESO and BFTL) were the main factors for the 2-way ANOVA analysis. Post-hoc comparisons were made using a Tukey’s test. Different letters indicate significant differences (p< 0.05) among plankton size fractions within same region. * denotes a significant difference (p< 0.05) between regions for the same plankton size fraction.

