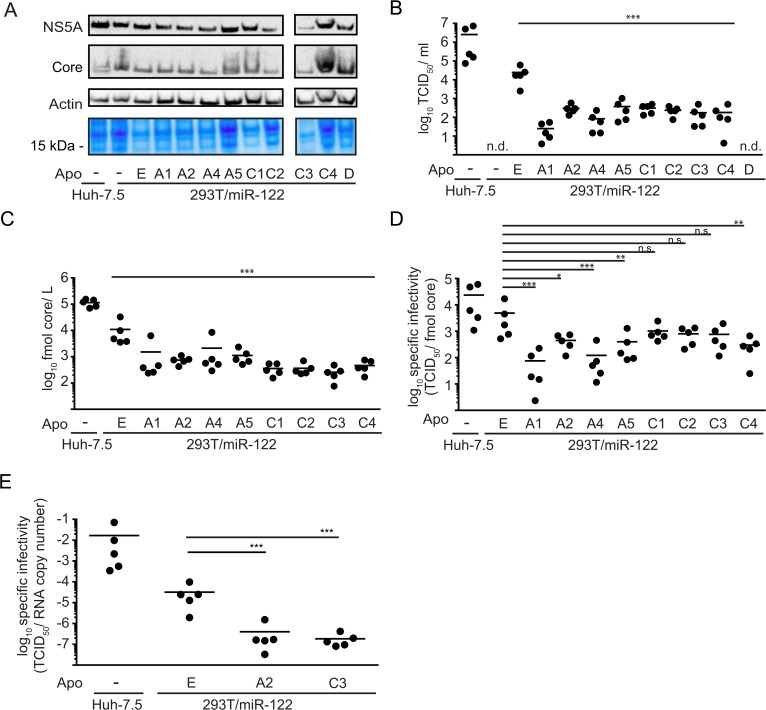
Fig 3. Expression of ApoA and ApoC protein family members complements HCV morphogenesis with reduced efficiency compared to ApoE.
A: HCV RNA (Jc1 wt) was used to transfect indicated cell lines. Expression of viral and cellular proteins was verified by Western blot using antibodies against core, NS5A and β-actin. Additionally, total protein content was visualized by Coomassie staining. B: To assess production of infectious virus particles, supernatants were used to infect naïve Huh-7.5 cells to determine the titer by endpoint dilution assay (TCID50/ ml). C: Secretion of core protein into the cell culture supernatant was quantified by core-specific ELISA. Results are shown as fmol core/ L D: Specific infectivity of HCV particles released from the indicated cell lines was calculated based on the data presented in panel (B) and (C) and is given as TCID50/ fmol core. E: Specific infectivity was additionally calculated for a selection of cell lines based on RNA copy number released into the supernatant and corresponding TCID50 values. For (A), (B), (C), (D) and (E), all samples were taken 48 h post transfection and each data point represents an individual experiment while the mean is depicted as a dash. Statistical analyses in these panels were performed by Dunnett’s multicomparison test. Significant changes in infectivity, core secretion or specific infectivity of cells expressing other apolipoproteins compared to ApoE are indicated (*** = p < 0.001, ** = p < 0.01, * = p < 0.05). n. s. = non-significant (p > 0.05), n. d. = not detected

