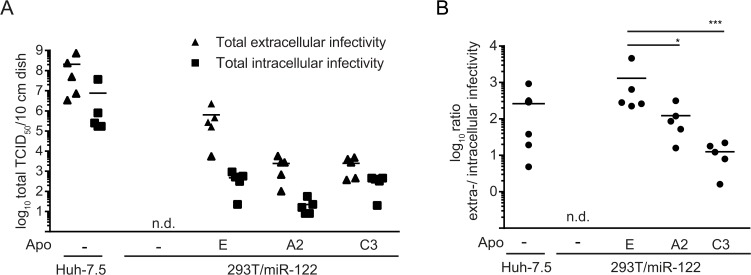
Fig 4. Different ratio between extracellular and intracellular infectious virus production in HCV transfected Huh-7.5 and 293T/miR-122 cells.
A: Depicted cell lines were transfected with HCV RNA (Jc1) and after 48 h, production of infectious virus particles was assessed in the cell culture supernatants as well as in freeze-thaw lysates by limited dilution assay. Shown are the viral titers per 10 cm culture dish. B: Ratio of extra- to intracellular infectivity was calculated based on data presented in panel (A). Statistical analyses were performed by Dunnett’s multicomparison test. Significant changes in infectivity of cells expressing ApoA2 or ApoC3 compared to ApoE are indicated. (* = p < 0.005, *** = p<0.001).

