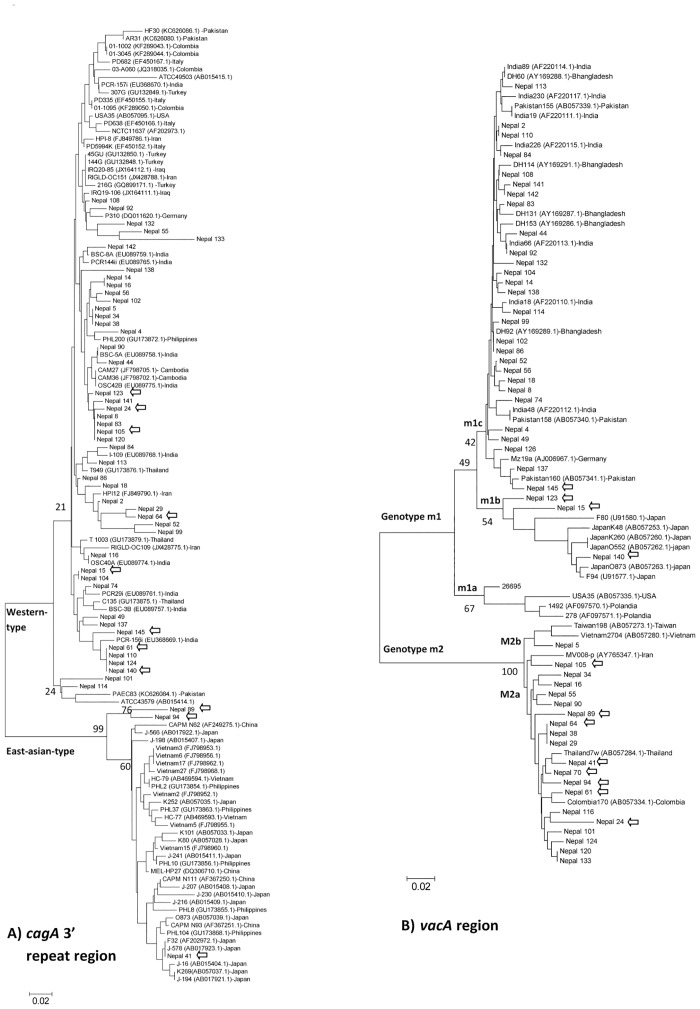
Fig 2. Phylogenetic analysis of the cagA 3´ repeat region (A), vacA m region (B), and reference sequences of Helicobacter pylori.
Genetic distances were estimated by the six-parameter method and phylogenetic trees were constructed by the neighbor-joining method. Strains with GenBank accession numbers are reference strains. Bootstrap values are shown along each main branch. The lengths of the horizontal bars indicate the number of nucleotide substitutions per site.

