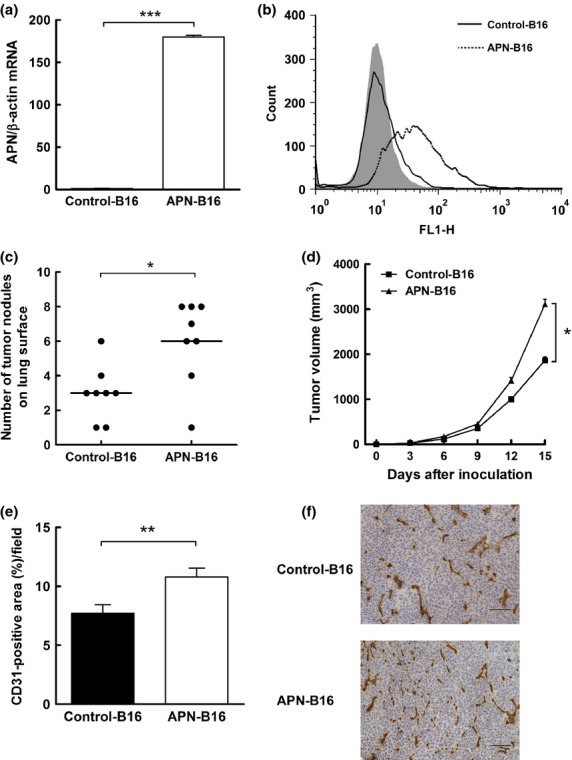
Fig 2.

Effects of human APN/CD13 expression in murine B16-F1 melanoma cells. (a) Expression levels of human APN/CD13 mRNA in control-B16 and APN-B16 cells were evaluated by quantitative real-time PCR. (b) Expression levels of APN/CD13 on the surface of control-B16 and APN-B16 cells were assessed by flow cytometry. Data (a) represent the mean (± SEM) of triplicate samples. $$$P < 0.001. (c) Comparison of the numbers of lung surface nodules in the tail vein metastasis model between control-B16 and APN-B16 cells. The numbers of lung surface nodules in mice were counted 21 days after injection of control-B16 and APN-B16 cells. Each bar represents the mean number of nodules for eight mice per group. $P < 0.05. (d) Comparison of tumor volumes in a subcutaneous tumor model for tumors derived from control-B16 and APN-B16 cells. The sizes of subcutaneous tumors were measured twice a week for 2 weeks after inoculation of control-B16 and APN-B16 cells. The data represent the mean (± SEM) for eight mice per group. $P < 0.05. (e) Evaluation of angiogenesis in subcutaneous tumors derived from control-B16 and APN-B16 cells. The area containing CD31-positive vessels was measured. Data represent the means (± SEM) from eight mice per group. $$P < 0.01. (f) Immunohistochemical staining for CD31 in a subcutaneous tumor. Scale bar, 100 μm.
