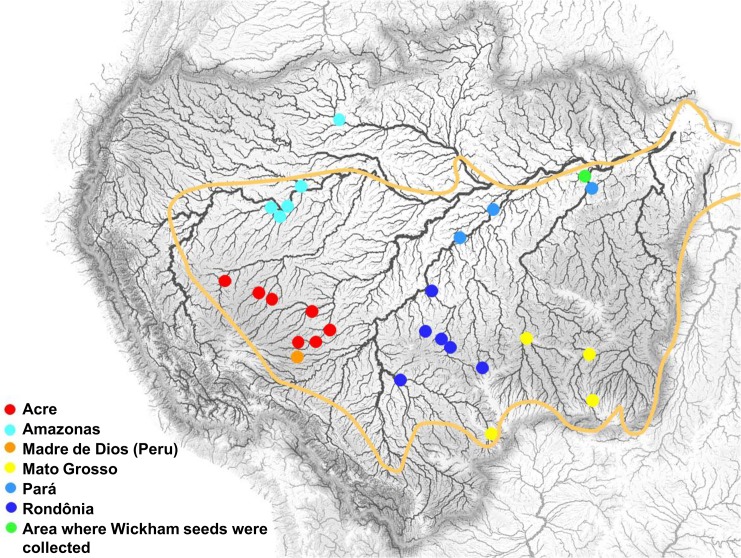
Fig 1. The locations of the sampled sites within Brazil.
The colors correspond to the population codes listed in Table 1 and other Figs. This Fig is similar but not identical to the original image from http://www.mappery.com/map-of/Amazon-Basin-Hydrosheds-Map.

