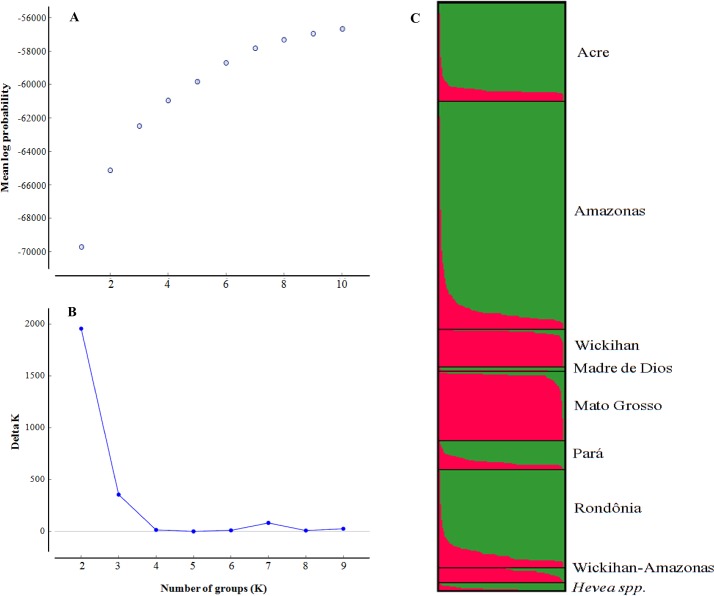
Fig 3. Genetic structure of the Hevea germplasm accessions.
The genetic structure was inferred through Bayesian analyses of the most probable number of groups (K) estimated based on the mean log probability [A] using the method described by Evanno et al. (2005) [B]. Each column (histogram) [C] represents the genotyping data from one accession, and the colors used in the histogram represent the most likely ancestry of the cluster from which the accessions were derived.

