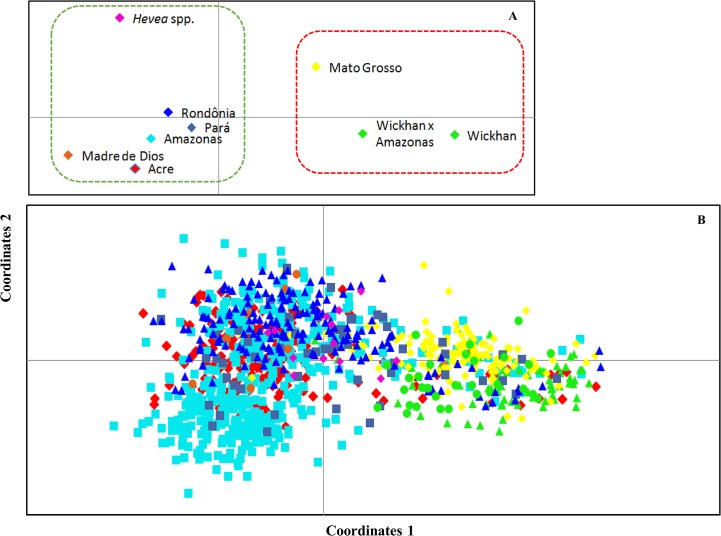
Fig 4. Dispersion graphics based on a principal coordinates analysis (PCoA) of the groups.
[A] Accessions (the dashed lines refer to the groups that were observed based on the analysis conducted using STRUCTURE software) [B] from the Hevea germplasm based on genotypic data from 13 microsatellite loci.

