Figure 2.
Continuous EEG-fMRI in focal epilepsy.
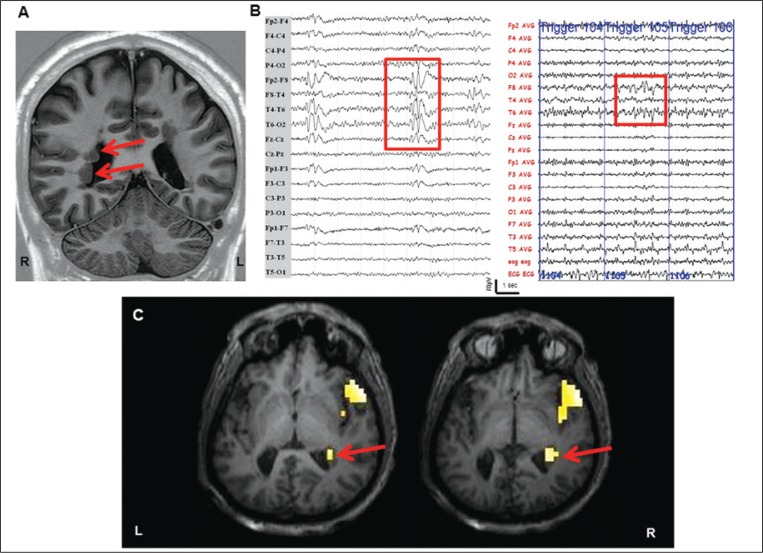
Structural MRI scan shows bilateral periventricular nodular heterotopia (Panel A, red arrows). Scalp EEG demonstrates short sequences of interictal spike and spike-wave discharges mainly on the right frontotemporal leads, highlighted in the red box (Panel B, left image). Panel B, right image shows the EEG recorded simultaneously during fMRI acquisitions after off-line subtraction of gradient artifacts. The EEG trace (32 channels) is displayed in bipolar montage. The consecutive numbers on the EEG (in blue) indicate the corresponding EPI acquired. Note the presence of interictal abnormalities over the right frontotemporal regions, highlighted by the red box. Panel C: IED-related BOLD results (p<0.05 corrected for family-wise errors). SPM8 software (http://www.fil.ion.ucl.ac.uk/spm/) was used for data analysis. Main clusters of BOLD signal increase (global maxima) were detected at the right temporopolar cortex and at the right nodules of subependymal heterotopia. No decrease in BOLD signal was observed. The fMRI results are displayed on the patient’s high-resolution T1-weighted structural scan. L: left; R: right.

