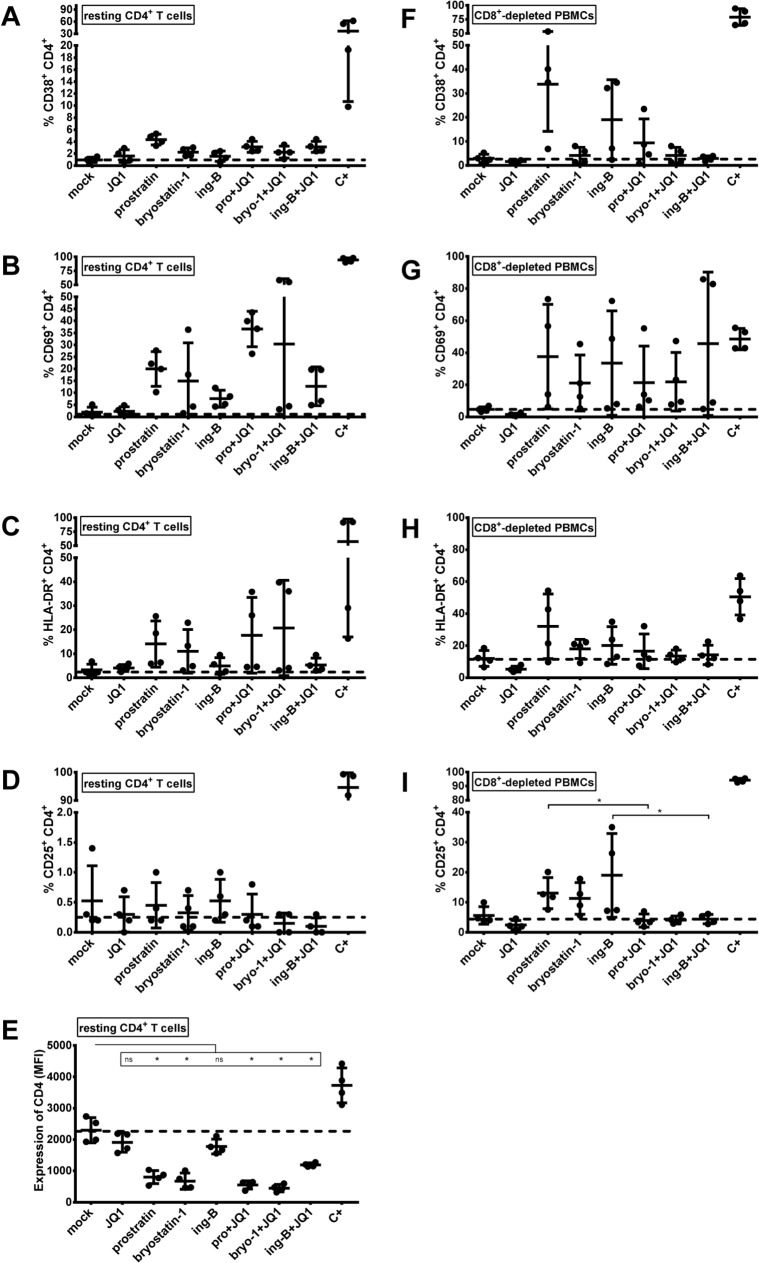
Fig 10. Expression of cell surface activation markers following PKC agonists and JQ1 treatments.
Blood from 4 uninfected donors was split and one half was used to purify resting CD4+ T cells (panels A-E) and the other half was used to purify CD8+-depleted PBMCs (panels F-I). Cell cultures were mock-treated, treated with anti-CD3+anti-CD28 antibodies (C+), JQ1 [0.25μM], bryostatin-1 [5nM], prostratin [0.5μM] or ing-B [10nM] alone or in combination for 6 days. Cells were incubated with anti-CD38 (panels A and F), anti-CD69 (panels B and G), anti-HLA-DR (panels C and H), anti-CD25 (panels D and I) or anti-CD4 (panel E) antibodies prior to flow cytometry analysis. The results are presented as percentage of marker expression in the population of CD4+ cells (panels A-D and panels F-I) and as median fluorescence intensity (MFI) of CD4+ cells (panel E). Dashed line indicates the percentage of expression obtained in mock-treated cells. The means are represented. Statistical comparisons are indicated. Statistically relevant and not statistically relevant comparisons are indicated by asterisk and “ns”, respectively.

