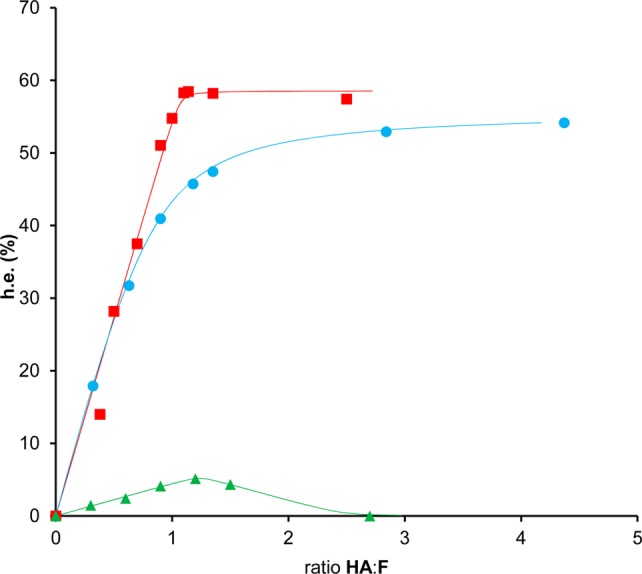
Figure 2.

Conformational preference of foldamer F4 (h.e.) at different ratios of HA:F in CDCl3 at 296 K: 8.8 < [F4] < 10.0 mM for titration experiment with HA1; [F4] = 10.0 mM for titration experiments with HA4 and HA6; blue ●, experimental data for HA1; red ■, experimental data for HA4; green ▲, experimental data for HA6. Curve fits shown for a 1:1 binding model using the program DynaFit: K = 103 M–1 (blue —), K = 105 M–1 (red —); Curve fit shown for a 2:1 binding model using the program DynaFit: K = 107 M–1 and K′ = 104 M–1 (green —).
