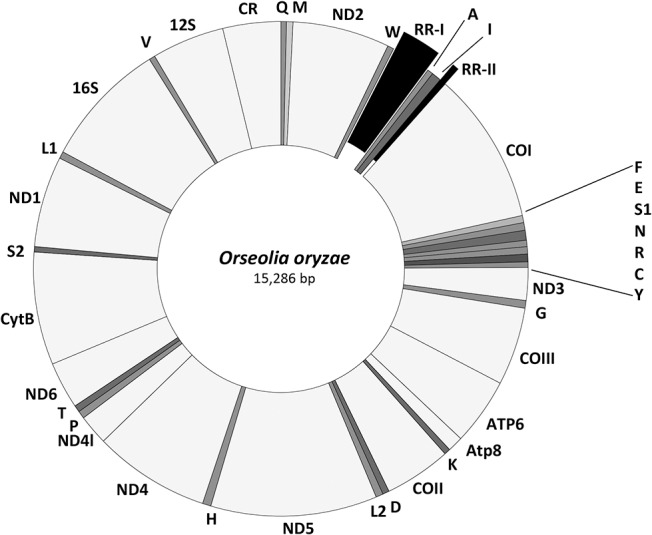
Fig 1. The structure of Orseolia oryzae mitochondrial genome.

The light grey areas indicate the PCGs, rRNAs and the control region and the dark grey areas indicate the different tRNAs. The exploding slices of the doughnut indicate the location of two repeat regions, RR-I and RR-II.
