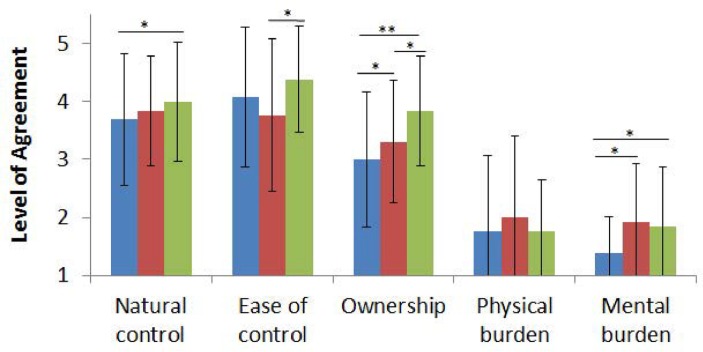
Fig 6. Average response of all the participants to the questionnaires for each of the three experiments (Blue, red and green respectively correspond to the first, second and third game).
Statements are ranked through 1 to 5 (1: Strong disagreement, 5: Strong agreement). *: p<0.05, **: p<0.01. The standard deviations are presented in the diagram.

