Abstract
♦ Aim:
In this study, we investigated, and this for the different classes of uremic toxins, whether increasing dialysate volume by shifting from continuous ambulatory peritoneal dialysis (CAPD) to higher volume automated peritoneal dialysis (APD) increases total solute clearance.
♦ Methods:
Patients on peritoneal dialysis were randomized in a cross-over design to one 24-hour session of first a CAPD regimen (3*2 L of Physioneal 1.36% and 1*2 L of icodextrin) or APD (consisting of 5 cycles of 2 L Physioneal 1.36 and 1 cycle of 2 L Extraneal), and the other week the alternate regime, each patient serving as his/her own control. Dialysate, blood and urine samples were collected and frozen for later batch analysis of concentrations of urea, creatinine, phosphorus, uric acid, hippuric acid, 3-carboxy-4-methyl-5-propyl-2-furanpropionic acid, indoxyl sulfate, indole acetic acid, and p-cresyl sulfate. For the protein-bound solutes, total and free fractions were determined. Total, peritoneal and renal clearance (K) and mass removal (MR) of each solute were calculated, using validated models.
♦ Results:
In 15 patients (11 male, 3 diabetics, 56 ± 16 years, 8 on CAPD, time on peritoneal dialysis 12 ± 14 months, and residual renal function of 9.9 ± 5.4 mL/min) dialysate over plasma ratio for creatinine (D/Pcrea) was 0.62 ± 0.10. Drained volume and obtained ultrafiltration were higher with APD vs CAPD (13.3 ± 0.5 L vs 8.5 ± 0.7 L and 1.3 ± 0.5 L vs 0.5 ± 0.7 L), whereas urine output was lower (1.0 ± 0.5 L vs 1.4 ± 0.6 L). Total clearance and MR tended to be higher for CAPD vs APD for all small and water soluble solutes, but mainly because of higher renal contribution, with no difference in the peritoneal contribution. For the protein-bound solutes, no differences in clearance or mass removal were observed.
♦ Conclusion:
Although the drained dialysate volume nearly doubled, APD did not result in better peritoneal clearance or solute removal vs classic CAPD. APD resulted in better ultrafiltration, but at the expense of residual urinary output and clearance.
Keywords: Uremic toxin, removal, clearance, APD, CAPD, dwells
It is an ongoing discussion whether continuous ambulatory peritoneal dialysis (CAPD) and automated peritoneal dialysis (APD) yield comparable results. In terms of mortality, several observational cohort studies have indicated that CAPD and APD have comparable survival rates (1–3). However, a re-analysis of the ANZDATA registry indicated that survival in fast transporters was better on APD vs CAPD, whereas the inverse was true for slow transporters (4). It was suggested that this effect could be explained by differences on volume status induced by the mismatch between peritoneal transport status and dwell length (5). An alternative explanation could be that the difference in survival rates was based on differences in obtained clearances of uremic retention products. ADEMEX has clearly demonstrated that small solute clearance as expressed in Kt/Vurea or creatinine clearance does not influence mortality (6). In addition, several studies have questioned whether increasing instilled volume by increasing the number of short dwells can result in higher small solute clearance. Nevertheless, many centers try to enhance clearance by switching to high-volume APD. Moreover, urea and creatinine have no toxic effect on their own, and it has been demonstrated in hemodialysis (7,8) and in patients with advanced renal failure not yet on dialysis (9) that the behavior of other uremic toxins contributing to uremic toxicity (10) is substantially different from that of urea itself, depending upon molecular size, degree of protein binding, distribution volume and compartmental behavior. In peritoneal dialysis, it has been observed that peritoneal transport rate and modality (APD vs CAPD) impacted on phosphate clearance and sodium removal, but not on urea clearance (11,12). Pham et al. (13) demonstrated that protein binding restricted the peritoneal clearance of indican and p-cresyl sulfate. However, the impact of modality was not evaluated as an influencing factor in that study.
The aim of the current study was to explore removal of a range of solutes from the different classes of uremic retention products (small solute vs middle molecules vs protein-bound solutes) in higher volume APD vs CAPD in a randomized cross-over study to evaluate whether increasing instilled volume by increasing the number of dwells results in enhanced clearance and/or removal of these molecules. As it was unclear whether higher ultrafiltration would impact on renal or peritoneal clearances or solute removal, we opted to analyze peritoneal and renal clearance separately.
Patients and Methods
Patients and Study Set-Up
The protocol of this study was evaluated and approved by the ethical committee of the Ghent University Hospital. All patients signed the informed consent. All interventions comply with the declaration of Helsinki.
This trial has been registered at Clinicaltrials.gov under the identifier: NCT00752583.
All patients on stable peritoneal dialysis (PD) in our unit and without peritonitis in the last 3 months were eligible for inclusion. Fifteen stable chronic kidney disease patients on maintenance peritoneal dialysis for at least 2 months were recruited. Regular treatment of all patients was according to an individualized dialysis scheme, with at least 4 exchanges/cycles per day with either longer or shorter dwells depending on the peritoneal membrane characteristics, using Physioneal (glucose solution) (Baxter Healthcare Corporation, Deerfield, IL, USA), or Extraneal (icodextrin solution) (Baxter Healthcare Corporation, Deerfield, IL, USA) as PD fluid.
In this prospective, randomized cross-over study, patients were followed during 24 hours on two experimental successive midweek occasions, at random, first on CAPD (consisting of 3 exchanges of 2 L Physioneal 1.36 and 1 exchange of 2 L Extraneal) or higher volume APD (consisting of 5 cycles of 2 L Physioneal 1.36 and 1 cycle of 2 L Extraneal), and the other week the alternate regime. Randomization was performed by means of an online program (www.randomisation.com) and sealed envelopes. Each patient served as his/her own control and no alterations in diet or medication were allowed during the test period.
The data of the CAPD test day were also used to determine dialysate over plasma (D/P) ratios for creatinine and assess peritoneal membrane transport characteristics.
Sampling and Data Collection
During each 24-hour test session, samples of PD effluent of all dwells and of urine were collected and stored at −80°C for later batch analysis, and total volume was registered. A blood sample was taken before each 24-hour test session, centrifuged (3,000 rpm corresponding to 1,250 g), aliquoted, and stored at −80°C for later batch analysis. Concentrations of different uremic retention solutes were determined in all samples. Urea (molecular weight MW 60D) and creatinine (Crea) (MW 113D) concentrations were measured by standard laboratory methods, using an isotope dilution standardized method (IDSM) for creatinine. Phosphorus concentrations were determined with a Modular analyzer (Roche Diagnostics GmbH, Vilvoorde, Belgium) and measured photometrically at 340 nm. Different other solutes were determined by high-performance liquid chromatography (HPLC): uric acid (UA) (MW 168D), hippuric acid (HA) (MW 179D, protein binding (PB)~50%), 3-carboxy-4-methyl-5-propyl-2-furanpropionic acid (CMPF) (MW 240D – PB~100%), indoxyl sulfate (IS) (MW 213D – PB~90%), indole acetic acid (IAA) (MW 175D – PB~65%), and p-cresyl sulfate (PCS) (MW 187D – PB~95%). To determine the total fraction of protein-bound solutes, serum samples were first deproteinized by heat denaturation (14) and analyses were performed by reverse-phase HPLC. IS and IAA (excitation λex:280 nm; emission λem:340 nm) and PCS (λex:265nm; λem:290 nm) were determined by fluorescence analysis, and HA was analyzed by UV detection at 254 nm. Free fractions were determined according to Fagugli et al. (15).
ELISA kits manufactured by Orgentec Diagnostika GmbH (Mainz, Germany) were used for measuring beta-2-microglobulin (β2M) (MW 11.8 kD).
Serum total protein was analyzed according to standard methods.
Calculations
For each 24-h test session, the renal and dialytic mass removal (MRR and MRD) were calculated as follows:
 |
(1) |
 |
(2) |
with CU and CD being the urine and spent dialysate concentration, and VU and VD being the urine and spent dialysate volume. Total mass removal MR was then defined as the sum of MRR and MRD.
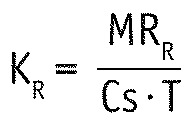
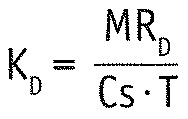
Renal and dialytic solute clearance (KR and KD) were calculated as follows:
 |
(3) |
 |
(4) |
with T being the test period of 24 hours and Cs the serum concentration as determined by the blood sampling. Since serum concentrations are stable over time in PD, they can replace time-averaged concentration. Total clearance K was then defined as the sum of KR and KD.
Statistical Analyses
Data are expressed as mean ± standard deviation for normal distributions and normality was checked with the Kolmogorov-Smirnov test. As all data of interest had a normal distribution, pair wise comparisons were done with the paired t-test. For all statistical analyses, SPSS Statistics 19 (SPSS Inc, Chicago, IL, USA) for Windows (Microsoft Corp, Redmond, WA, USA) was used. As the hypothesis was that there would be no difference between the two treatment regimes for any of the investigated toxins, and this was confirmed, no adjusting for multiple comparisons was done.
Results
In this cohort of 15 (11 male, 3 patients with diabetes mellitus, 8 on CAPD and 7 on APD mode) PD patients, mean age was 56 ± 16 years, time on peritoneal dialysis 12 ± 14 months, and residual renal function 9.9 ± 5.4 mL/min.
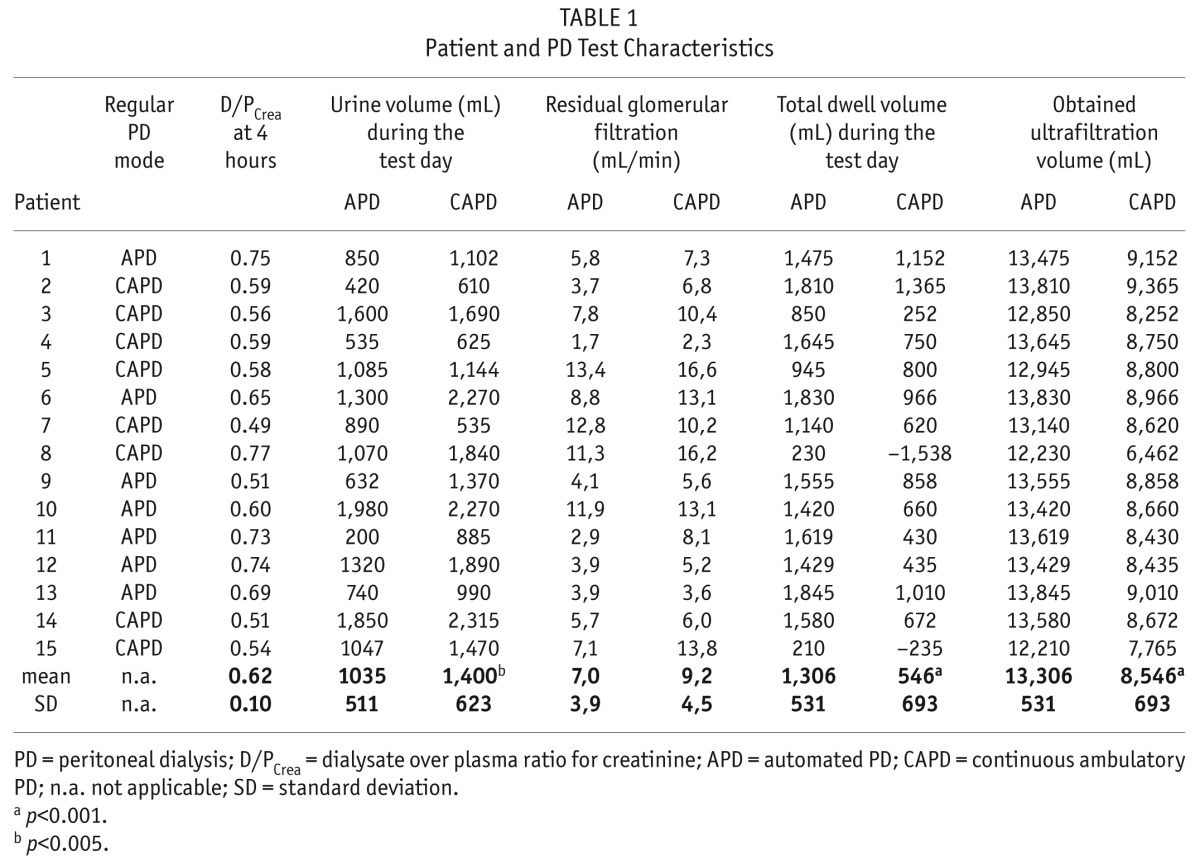
D/Pcrea was 0.62 ± 0.10, with 2 slow, 8 slow average, and 5 fast average transporter peritoneal membranes. As intended by the study protocol, the total drained dialysate volume and obtained ultrafiltration were higher with APD vs CAPD (13.3 ± 0.5 L vs 8.5 ± 0.7 L, p < 0.001 and 1.3 ± 0.5 L vs 0.5 ± 0.7 L, p < 0.001, respectively). Urine output, however, was significantly higher with CAPD vs APD (1.4 ± 0.6 L vs 1.0 ± 0.5 L, p = 0.005) (Table 1).
TABLE 1.
Patient and PD Test Characteristics
Calculated total mass removals (MR), and total clearances (K) are shown in Table 2 for the different solutes under study. Clearances and mass removal of all the protein bound solutes included in this study were not different with CAPD vs higher volume APD. There was no transperitoneal removal of the 100% protein-bound solute CMPF by CAPD or APD.
TABLE 2.
Serum Concentration, Mass Removal, and Clearance on APD Versus CAPD for the Different Solutes Under Study
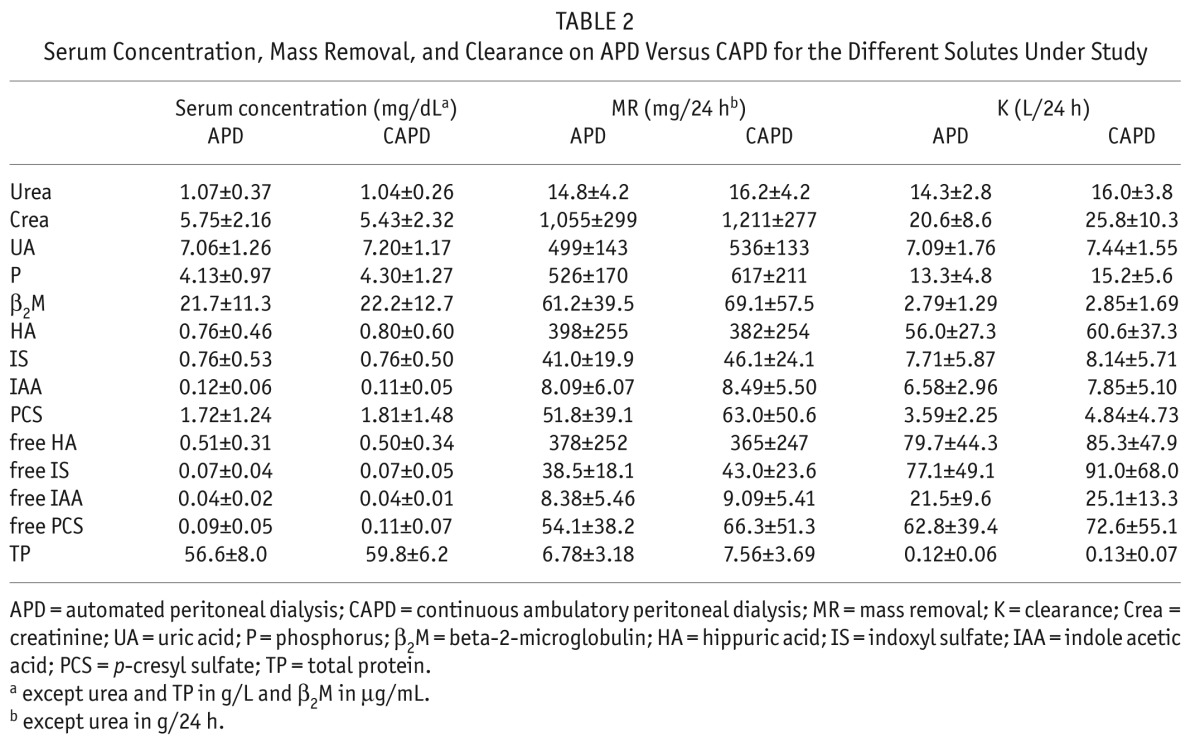
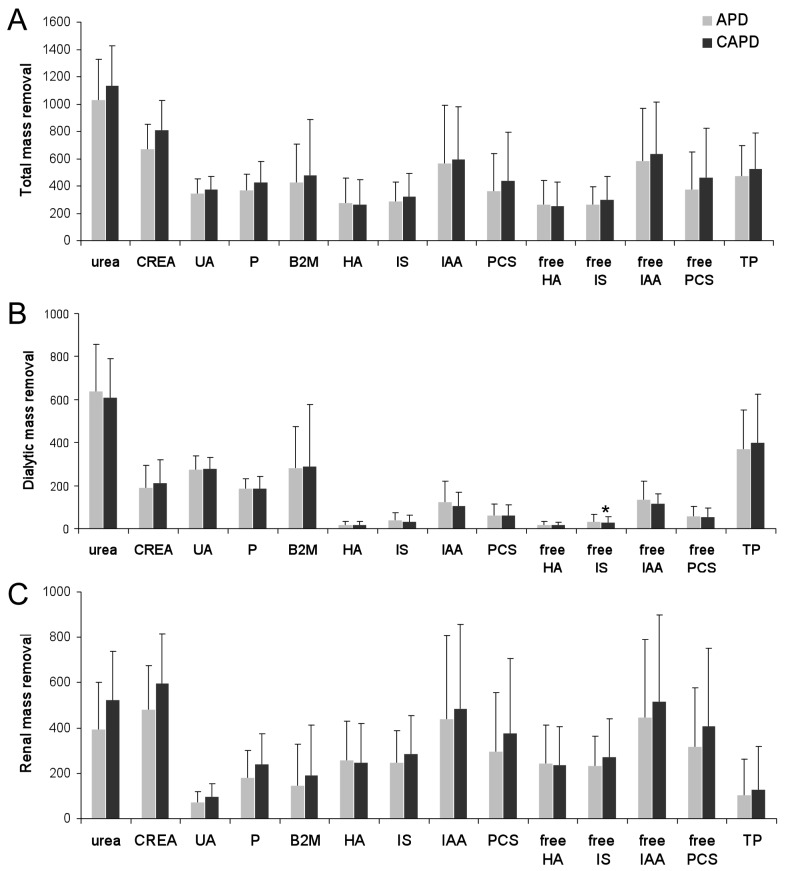
The mass removals are depicted separately in Figure 1, representing total, dialytic, and renal MR. There was no difference for the transperitoneal mass removal of any of the uremic solutes tested between CAPD and APD, whereas renal mass removal tended to be higher with CAPD compared to APD for the small solutes urea, creatinine, uric acid, and phosphate, as well as for the middle molecule β2M.
Figure 1 —
Total (panel A), dialytic (panel B), and renal (panel C) mass removal with APD (automated peritoneal dialysis) versus CAPD (continuous ambulatory peritoneal dialysis) for urea (0.1g/week), creatinine (CREA) (cg/week), UA (uric acid) (cg/week), P (phosphorus) (cg/week), β2M (beta-2-microlglobulin) (mg/week), HA (hippuric acid) (cg/week), IS (indoxyl sulfate) (mg/week), IAA (indole acetic acid) (0.1 mg/week), PCS (p-cresyl sulfate) (mg/week), free HA (cg/week), free IS (mg/week), free IAA (0.1mg/week), free PCS (mg/week), and TP (total protein) (0.1g/week).
There was no difference in solute removal patterns during the study between patients who had CAPD vs APD as their original regime (Table 1).
Discussion
This randomized cross-over trial indicates that there is no difference in transperitoneal mass removal between CAPD vs higher volume APD for any of the tested molecules of different classes of uremic toxins, irrespective of the transport status of the patient. There was a higher mass removal by the renal route during the CAPD episode, however.
Increasing the total volume by increasing the number of short dwells should be discouraged, as it leads to more exposure to the harmful components of peritoneal dialysate but not to increased solute removal. A better strategy is to optimize the duration of each dwell, allowing optimal ultrafiltration and diffusive equilibration (16). Achieved ultrafiltration was better during APD, but at the expense of urinary output and clearance, so it is unclear whether this would improve patient outcomes.
Also, in PD, there is a tendency to define “adequacy” no longer in terms of small solute clearance, but rather as a good mix of removal of uremic toxins and of salt and water. In addition, avoidance of toxicity and preservation of quality of life are gaining importance as additional adequacy criteria. It has been demonstrated before that transperitoneal removal of small solutes does not substantially increase when the number of dwells within a fixed time period is increased, as is typically done during APD (17). Our study confirms these data and adds to the existing knowledge by demonstrating that total mass removal in CAPD was equal to that with higher volume APD for the protein-bound solutes. To our knowledge, it is the first time that different classes of uremic toxins were analyzed comparing CAPD vs higher volume APD using a randomized cross-over design with patients being their own controls, so that inter-individual differences on the behavior of these molecules were excluded. This is an important finding, as it has been well established that uremic toxicity does not come from urea or creatinine, but rather from other substances, such as middle molecules and protein-bound solutes (18,19). Previous studies analyzing solute clearance in APD vs CAPD (20,21) all had a cross-sectional observational design so it could not be excluded that inter-individual, e.g. dietary, differences explained the observations.
The contribution of peritoneal clearance to the total removal of protein-bound solutes such as indoxyl sulfate was rather limited, confirming earlier data (13,21), which point out that the removal of protein-bound solutes in PD is strongly dependent upon residual renal function. Preservation of residual renal function is thus of utmost importance. Huang et al. (21) also observed the absence of a correlation between peritoneal clearances of water-soluble solutes and protein-bound solutes, just as in our study. Substitution of residual renal function by peritoneal clearance is thus very difficult for protein-bound solutes, if not impossible, and can not be predicted by small solute clearance.
We observed better phosphate removal during CAPD as compared to higher volume APD, mainly because of improved renal clearance, confirming other literature data (20,22). We confirmed that for slow transporters, longer dwells resulted in higher peritoneal phosphate clearances (23), whereas for high transporters, shorter dwells were more optimal.
Volume homeostasis has become an important adequacy parameter (5). Our results indicate that CAPD results in lower net ultrafiltration as compared to higher volume APD, which was compensated by increased diuresis. As our study was a short-term 24-hour study, the impact of sodium retention on fluid balance or blood pressure could not be adequately assessed, but several other authors have demonstrated that salt removal in APD is inferior to CAPD (24,25). However, this is probably only true if too short dwells are applied in patients with a non-fast transport type, leading to fluid overload (5). There has been debate on the long term impact on residual diuresis of APD vs CAPD, with conflicting findings (26,27). Most likely, these different results are induced by the different application of APD, and probably APD is only harmful for residual renal function if overly strong ultrafiltration is induced.
Increasing the total dwell volume leads to enhanced exposure of the peritoneal membrane to glucose and glucose degradation products. Accumulation of advanced glycation end products (AGEs) and Glucose Degradation Products (GDPs) present in non-biocompatible PD solutions occurs already during the first two hours of the dwell (28). Accordingly, increasing the dialysate volume offered in short dwells will lead to accumulation of AGEs and GDPs, with all the associated detrimental effects. Michels et al. (26) found a faster deterioration of transcapillary ultrafiltration over time in APD patients, a phenomenon that could not be detected by a difference in small solute transport (29).
The major limitation of this study is that clearances and solute removal were only based on a 24-hour treatment switch. Another limitation is that we did not include anuric patients. Due to the laborious intervention (change of treatment modality) the patient number is also low.
In conclusion, our results confirm that increasing total dialysate volume by introducing more short dwells does not result in improved clearance of uremic toxins of different classes. In addition, it might lead to faster deterioration of residual renal function, and certainly increases the toxicity associated with dialysate solutions. The recommendation to optimize dwell time to transport type (16) to optimize ultrafiltration, and to avoid high volume APD, can thus be supported.
Disclosures
The authors have no financial conflicts of interest to declare.
Acknowledgments
The authors are indebted to the laboratory staff, M.A. Waterloos and M. Van Landschoot for their assistance.
REFERENCES
- 1. Mehrotra R, Chiu YW, Kalantar-Zadeh K, Vonesh E. The outcomes of continuous ambulatory and automated peritoneal dialysis are similar. Kidney Int 2009; 76(1):97–107. [DOI] [PubMed] [Google Scholar]
- 2. Michels WM, Verduijn M, Boeschoten EW, Dekker FW, Krediet RT. Similar survival on automated peritoneal dialysis and continuous ambulatory peritoneal dialysis in a large prospective cohort. Clin J Am Soc Nephrol 2009; 4(5):943–9. [DOI] [PMC free article] [PubMed] [Google Scholar]
- 3. Badve SV, Hawley CM, McDonald SP, Mudge DW, Rosman JB, Brown FG, et al. Automated and continuous ambulatory peritoneal dialysis have similar outcomes. Kidney Int 2008; 73(4):480–8. [DOI] [PubMed] [Google Scholar]
- 4. Johnson DW, Hawley CM, McDonald SP, Brown FG, Rosman JB, Wiggins KJ, et al. Superior survival of high transporters treated with automated versus continuous ambulatory peritoneal dialysis. Nephrol Dial Transplant 2010; 25(6):1973–9. [DOI] [PubMed] [Google Scholar]
- 5. Van Biesen W, Williams JD, Covic AC, Fan S, Claes K, Lichodziejewska-Niemierko M, et al. Fluid status in peritoneal dialysis patients: the European Body Composition Monitoring (EuroBCM) study cohort. PLoS One 2011; 6(2):e17148. [DOI] [PMC free article] [PubMed] [Google Scholar]
- 6. Paniagua R, Amato D, Vonesh E, Correa-Rotter R, Ramos A, Moran J, et al. Effects of increased peritoneal clearances on mortality rates in peritoneal dialysis: ADEMEX, a prospective, randomized, controlled trial. J Am Soc Nephrol 2002; 13(5):1307–20. [DOI] [PubMed] [Google Scholar]
- 7. Eloot S, Van Biesen W, Dhondt A, De Smet R, Marescau B, De Deyn PP, et al. Impact of increasing haemodialysis frequency versus haemodialysis duration on removal of urea and guanidino compounds: a kinetic analysis. Nephrol Dial Transplant 2009; 24(7):2225–32. [DOI] [PubMed] [Google Scholar]
- 8. Eloot S, Van Biesen W, Dhondt A, Van de Wynkele H, Glorieux G, Verdonck P, et al. Impact of hemodialysis duration on the removal of uremic retention solutes. Kidney Int 2008; 73(6):765–70. [DOI] [PubMed] [Google Scholar]
- 9. Eloot S, Schepers E, Barreto DV, Barreto FC, Liabeuf S, Van Biesen W, et al. Estimated glomerular filtration rate is a poor predictor of concentration for a broad range of uremic toxins. Clin J Am Soc Nephrol 2011; 6(6):1266–73. [DOI] [PMC free article] [PubMed] [Google Scholar]
- 10. Neirynck N, Vanholder R, Schepers E, Eloot S, Pletinck A, Glorieux G. An update on uremic toxins. Int Urol Nephrol 2013; 45(1):139–50. [DOI] [PubMed] [Google Scholar]
- 11. Badve SV, Zimmerman DL, Knoll GA, Burns KD, McCormick BB. Peritoneal phosphate clearance is influenced by peritoneal dialysis modality, independent of peritoneal transport characteristics. Clin J Am Soc Nephrol 2008; 3(6):1711–7. [DOI] [PMC free article] [PubMed] [Google Scholar]
- 12. Sedlacek M, Dimaano F, Uribarri J. Relationship between phosphorus and creatinine clearance in peritoneal dialysis: clinical implications. Am J Kid Dis 2000; 36(5):1020–4. [DOI] [PubMed] [Google Scholar]
- 13. Pham NM, Recht NS, Hostetter TH, Meyer TW. Removal of the protein-bound solutes indican and p-cresyl sulfate by peritoneal dialysis. Clin J Am Soc Nephrol 2008; 3(1):85–90. [DOI] [PMC free article] [PubMed] [Google Scholar]
- 14. Vanholder R, De Smet R, Ringoir S. Studies of protein bound substances in uremia. ASAIO J 1994; 40(1):90–2. [PubMed] [Google Scholar]
- 15. Fagugli RM, De Smet R, Buoncristiani U, Lameire N, Vanholder R. Behavior of non-protein-bound and protein-bound uremic solutes during daily hemodialysis. Am J Kid Dis 2002; 40(2):339–47. [DOI] [PubMed] [Google Scholar]
- 16. Van Biesen W, Heimburger O, Krediet R, Rippe B, La Milia V, Covic A, et al. Evaluation of peritoneal membrane characteristics: clinical advice for prescription management by the ERBP working group. Nephrol Dial Transplant 2010; 25(7):2052–62. [DOI] [PubMed] [Google Scholar]
- 17. Demetriou D, Habicht A, Schillinger M, Horl WH, Vychytil A. Adequacy of automated peritoneal dialysis with and without manual daytime exchange: A randomized controlled trial. Kidney Int 2006; 70(9):1649–55. [DOI] [PubMed] [Google Scholar]
- 18. Vanholder R, Schepers E, Pletinck A, Neirynck N, Glorieux G. An update on protein-bound uremic retention solutes. J Ren Nutr 2012; 22(1):90–4. [DOI] [PubMed] [Google Scholar]
- 19. Vanholder R, Baurmeister U, Brunet P, Cohen G, Glorieux G, Jankowski J. A bench to bedside view of uremic toxins. J Am Soc Nephrol 2008; 19(5):863–70. [DOI] [PubMed] [Google Scholar]
- 20. Bernardo AP, Contesse SA, Bajo MA, Rodrigues A, Del Peso G, Ossorio M, et al. Peritoneal membrane phosphate transport status: a cornerstone in phosphate handling in peritoneal dialysis. Clin J Am Soc Nephrol 2011; 6(3):591–7. [DOI] [PMC free article] [PubMed] [Google Scholar]
- 21. Huang WH, Hung CC, Yang CW, Huang JY. High correlation between clearance of renal protein-bound uremic toxins (indoxyl sulfate and p-cresyl sulfate) and renal water-soluble toxins in peritoneal dialysis patients. Ther Apher Dial 2012; 16(4):361–7. [DOI] [PubMed] [Google Scholar]
- 22. Botelho C, Rodrigues A, Oliveira JC, Cabrita A. Peritoneal phosphate removal varies by peritoneal dialysis regimen: an underestimated parameter of phosphate control. J Nephrol 2013; 26(1):183–90. [DOI] [PubMed] [Google Scholar]
- 23. Sawin DA, Himmele R, Diaz-Buxo JA. Phosphate clearance in peritoneal dialysis: automated PD compared with continuous ambulatory PD. Adv Perit Dial 2012; 28:120–5. [PubMed] [Google Scholar]
- 24. Rodriguez-Carmona A, Fontan MP. Sodium removal in patients undergoing CAPD and automated peritoneal dialysis. Perit Dial Int 2002; 22(6):705–13. [PubMed] [Google Scholar]
- 25. Ortega O, Gallar P, Carreno A, Gutierrez M, Rodriguez I, Oliet A, et al. Peritoneal sodium mass removal in continuous ambulatory peritoneal dialysis and automated peritoneal dialysis: influence on blood pressure control. Am J Nephrol 2001; 21(3):189–93. [DOI] [PubMed] [Google Scholar]
- 26. Michels WM, Verduijn M, Grootendorst DC, le Cessie S, Boeschoten EW, Dekker FW, et al. Decline in residual renal function in automated compared with continuous ambulatory peritoneal dialysis. Am Soc Nephrol 2011; 6(3):537–42. [DOI] [PMC free article] [PubMed] [Google Scholar]
- 27. Balasubramanian G, McKitty K, Fan SL. Comparing automated peritoneal dialysis with continuous ambulatory peritoneal dialysis: survival and quality of life differences? Nephrol Dial Transplant 2011; 26(5):1702–8. [DOI] [PubMed] [Google Scholar]
- 28. Zeier M, Schwenger V, Deppisch R, Haug U, Weigel K, Bahner U, et al. Glucose degradation products in PD fluids: do they disappear from the peritoneal cavity and enter the systemic circulation? Kidney Int 2003; 63(1):298–305. [DOI] [PubMed] [Google Scholar]
- 29. Michels WM, Zweers MM, Smit W, Korevaar J, Struijk DG, van Westrhenen R, et al. Does lymphatic absorption change with the duration of peritoneal dialysis? Perit Dial Int 2004; 24(4):347–52. [PubMed] [Google Scholar]


