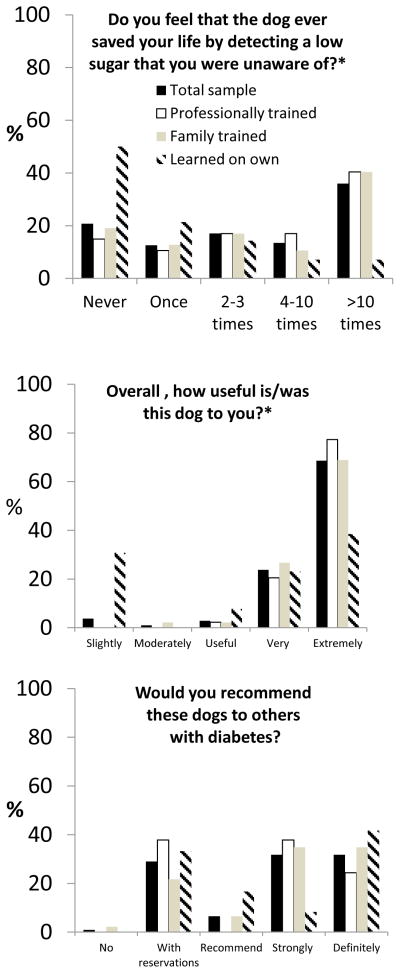
Figure 2.
Responses to items about perceptions of glucose detecting dogs. Proportions of respondents endorsing each response category are shown for the full sample (n = 135) in filled black bars. Additionally, proportions of persons endorsing each response category are also shown based on how the dogs learned to detect glucose levels; owners of professionally trained dogs are shown in open bars (n = 54), owners who trained the dogs themselves are shown in grey bars (n = 51), and owners of dogs who learned on their own are shown in hatched bars (n = 15). The asterisks indicate statistically significant differences between the three groups. See text for further details.

